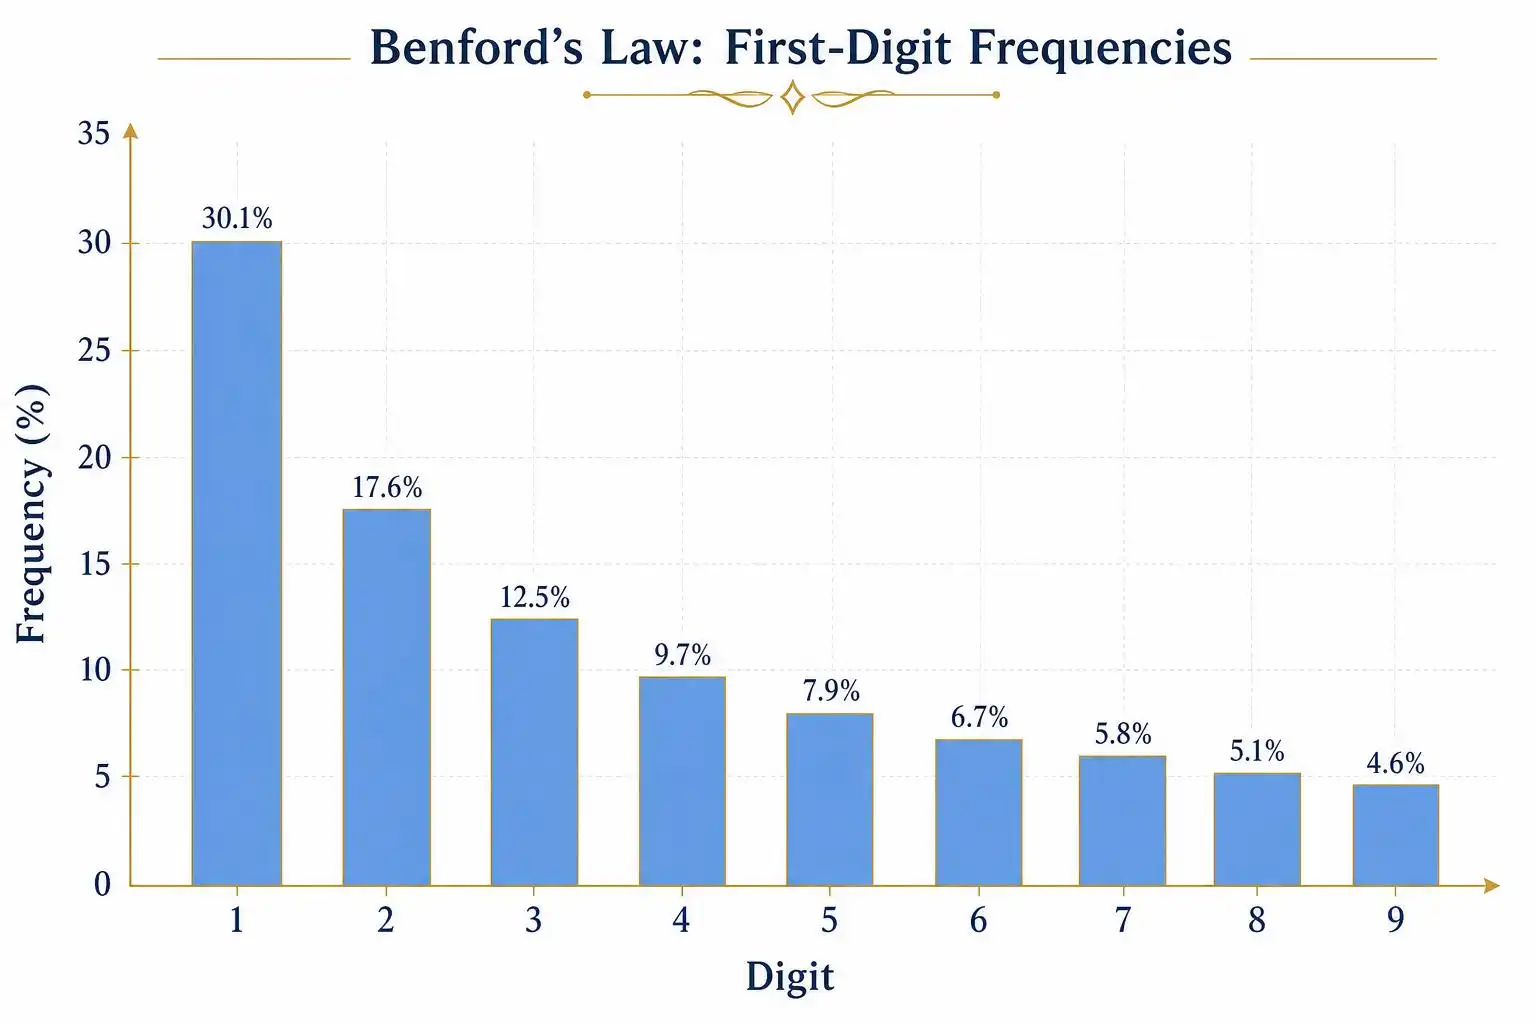

Pull up many large, organic collections of numbers — the populations of every country on Earth, the amounts on a year of corporate invoices, the lengths of every river, the closing prices of every stock — and count how often each leading digit appears. Not the whole number, just the very first digit you read from the left. You might expect each digit from 1 through 9 to show up about equally often, roughly 11% of the time each. Instead, you’ll find something eerie: numbers starting with 1 appear about 30% of the time, numbers starting with 9 appear less than 5% of the time, and everything in between falls along a smooth, predictable curve. This is Benford’s Law, and it is one of the strangest, most useful facts in all of applied mathematics.
The Discovery Nobody Believed at First
The pattern was first noticed in 1881 by the astronomer Simon Newcomb, who observed something odd in the library: the pages of logarithm tables that started with the digit 1 were far more worn and smudged than the pages starting with 9. People were looking up numbers beginning with 1 much more often than numbers beginning with 9. Newcomb wrote a short paper about it, and then the observation was largely forgotten for over fifty years.
In 1938, the physicist Frank Benford rediscovered the same pattern independently, but he didn’t stop at logarithm tables. He tested it against 20,229 numbers pulled from wildly different sources — the surface areas of rivers, baseball statistics, atomic weights of elements, numbers pulled from newspaper articles, street addresses, death rates. Over and over, the leading digit 1 showed up roughly 30% of the time. The law now bears his name, even though Newcomb saw it first, which is itself a small, ironic joke about how credit gets distributed unevenly, much like the digits themselves.
Working Out the Actual Formula
Benford’s Law isn’t just “1 is common, 9 is rare” as a vague impression — it gives an exact prediction. The probability that a number’s leading digit is d is:
P(d) = log₁₀(1 + 1/d)
Plug in d = 1, and you get log₁₀(2) ≈ 0.301, meaning about 30.1% of leading digits should be 1. Plug in d = 9, and you get log₁₀(10/9) ≈ 0.046, meaning only about 4.6% should be 9. The full distribution looks like this: 1 appears 30.1% of the time, 2 appears 17.6%, 3 appears 12.5%, 4 appears 9.7%, 5 appears 7.9%, 6 appears 6.7%, 7 appears 5.8%, 8 appears 5.1%, and 9 appears 4.6%. Notice these all sum to 100%, and notice they’re strictly decreasing — each digit is less likely than the one before it.
The intuition behind that logarithm comes from thinking about growth on a multiplicative scale rather than an additive one. Imagine a quantity that grows exponentially, like a population increasing by a fixed percentage each year — say 100 people growing at 10% annually. It takes a while to grow from 100 to 199 (still starting with 1), because you only need to grow by 99%. But once you reach 200, it takes much less relative growth to get from 200 to 299 or from 900 to 999, because the required percentage increase keeps shrinking as the leading digit climbs. So the number spends a disproportionate amount of its “life” with a leading digit of 1, then 2, and so on, spending the least time of all with a leading digit of 9 before it rolls back over to 1 by crossing into the next power of ten. If you tracked that population over a long enough span and jotted down its value once a year, you’d find its leading digits gradually approach Benford’s Law.
This approach happens because the logarithms of the yearly values become evenly spread out, a property mathematicians call equidistribution, but it generally requires many decades of data rather than an ordinary short run of years to show up clearly.
Which Numbers Follow the Law, and Which Don’t
Not every list of numbers obeys Benford’s Law, and knowing why is the key to understanding it. The law tends to appear in data that spans several orders of magnitude — numbers that range from single digits up into the thousands, millions, or beyond, like the populations of cities (some have a few hundred residents, others have tens of millions) or the assets on a company’s balance sheet. It also tends to appear in data generated by multiplicative processes, like compound growth, physical measurements pulled from nature, or numbers that are ratios and combinations of other Benford-distributed numbers. Whether a given data set actually fits depends heavily on its range, any built-in minimums or maximums, and whether it mixes several unrelated distributions together.
The law breaks down for data that’s artificially restricted to a narrow range. Human heights in centimeters mostly fall between 140 and 200, so there’s no room for the leading digit to vary across 1 through 9 — you’ll see mostly 1s regardless. Phone numbers, lottery numbers, and assigned ID codes don’t follow it either, because they’re arbitrary labels, often deliberately designed to be uniform, rather than outputs of organic growth or measurement. Naturally occurring counts, by contrast, can still follow the law; it’s specifically assigned labels, not counted quantities in general, that tend to resist it.
Catching Fraud With a Logarithm
This is where Benford’s Law jumps from curiosity to a genuinely useful screening tool: forensic accountants and fraud investigators sometimes use it to flag suspicious financial records. Real, unmanipulated financial data — tax returns, expense reports, invoice amounts, accounting entries — often follows Benford’s distribution reasonably well when it spans a wide enough range, because it can be generated by the same kind of organic, multiplicative growth as populations and river lengths, though many legitimate data sets deviate from it for innocent reasons tied to their range or structure. But when a person fabricates numbers, they tend to do it psychologically, not statistically. People invent fake expense amounts that “feel” random, which usually means they overuse middle digits like 5, 6, and 7, and they distribute leading digits far more evenly than nature ever would.
Investigators run a chi-squared test — a statistical comparison between the observed frequency of leading digits in a data set and the frequency Benford’s Law predicts — and a large deviation is worth investigating further, though it is not on its own proof of wrongdoing since honest data sets can deviate for many legitimate reasons. This exact method has been used to help flag possible fraud in tax filings, to check manipulated macroeconomic statistics reported by governments, and even to scrutinize scientific data sets suspected of being fabricated rather than genuinely collected. It was cited as a piece of evidence in some financial fraud investigations, and some U.S. courts have accepted Benford’s Law analysis as admissible evidence. It won’t prove guilt on its own — an honest data set can easily deviate for reasons having nothing to do with fraud, and a clever forger might learn to fake the distribution — but as a first-pass screening tool sorting thousands of records down to a suspicious handful worth a closer look, it can be a useful and cheap starting point.
Beyond the First Digit
Once you know to look, the pattern extends further than you’d guess. There’s a version of Benford’s Law for the second digit of a number, and even the second digit shows a lopsided preference, just a gentler one — the digit 0 is slightly more common in the second position than the digit 9. Mathematicians have also shown that Benford’s Law is, in a precise sense, the only digit distribution that is “scale invariant,” meaning it doesn’t change if you convert your data from dollars to euros, or meters to feet. That’s a deep and slightly startling fact: it means Benford’s Law isn’t an accident of how humans write numbers in base ten, but something closer to a mathematical necessity for any distribution that’s supposed to describe reality regardless of the units you happen to measure it in.
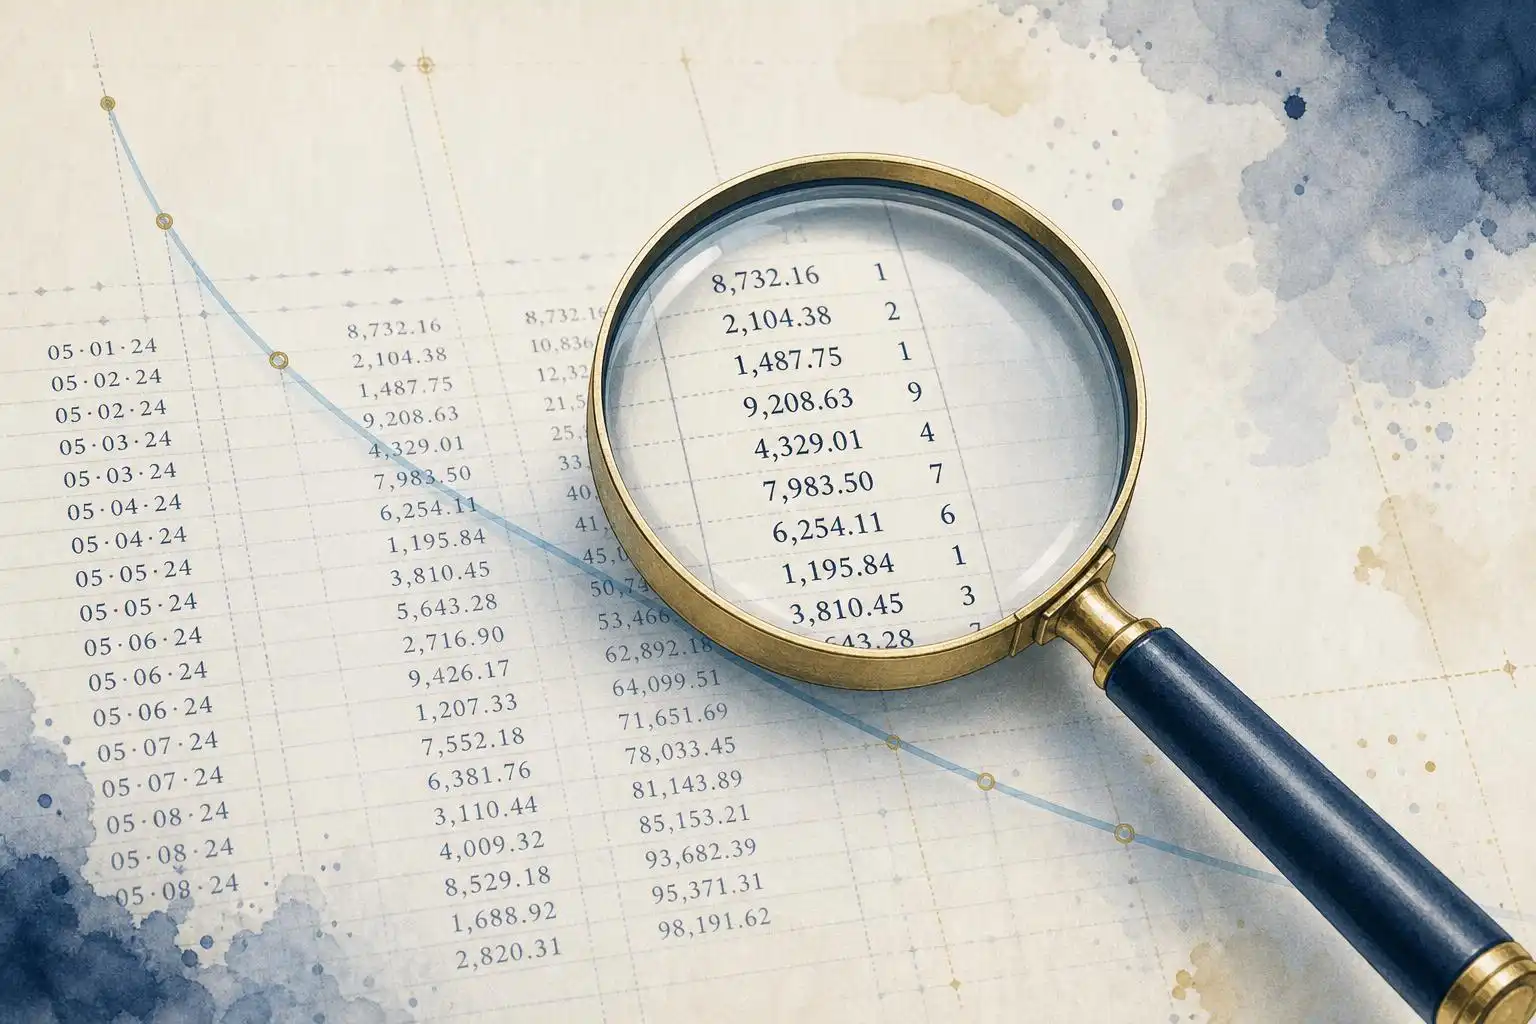
The next time you’re staring at a spreadsheet, a government budget, or your own bank statement, try the experiment yourself. Tally up the leading digits across a hundred or so entries — invoice totals, account balances, whatever’s on hand — and compare the tally to Benford’s predicted curve. Sometimes you’ll get an uncanny match, a quiet reminder that even in the most mundane pile of numbers, there can be a hidden geometry of growth writing its signature into every first digit.


Leave a Reply