
Pull up a map of Britain and trace its coastline with your finger. Now zoom in. The smooth curve you drew a moment ago dissolves into bays, inlets, and rocky headlands. Zoom in further — individual boulders, tide pools, pebbles. Each scale reveals new jaggedness that wasn’t visible before. Now ask yourself: how long is the coastline of Britain, exactly?
The troubling answer, which the mathematician Benoit Mandelbrot formalized in 1967, is: it depends entirely on how you measure it — and over the range where a coastline is well modeled as fractal, measuring more carefully makes the answer grow. This isn’t a failure of our instruments. It’s a fundamental property of a certain class of shapes that live between the familiar dimensions of geometry. We call them fractals, and once you see them, you find them absolutely everywhere.
The Coastline Paradox, Explained
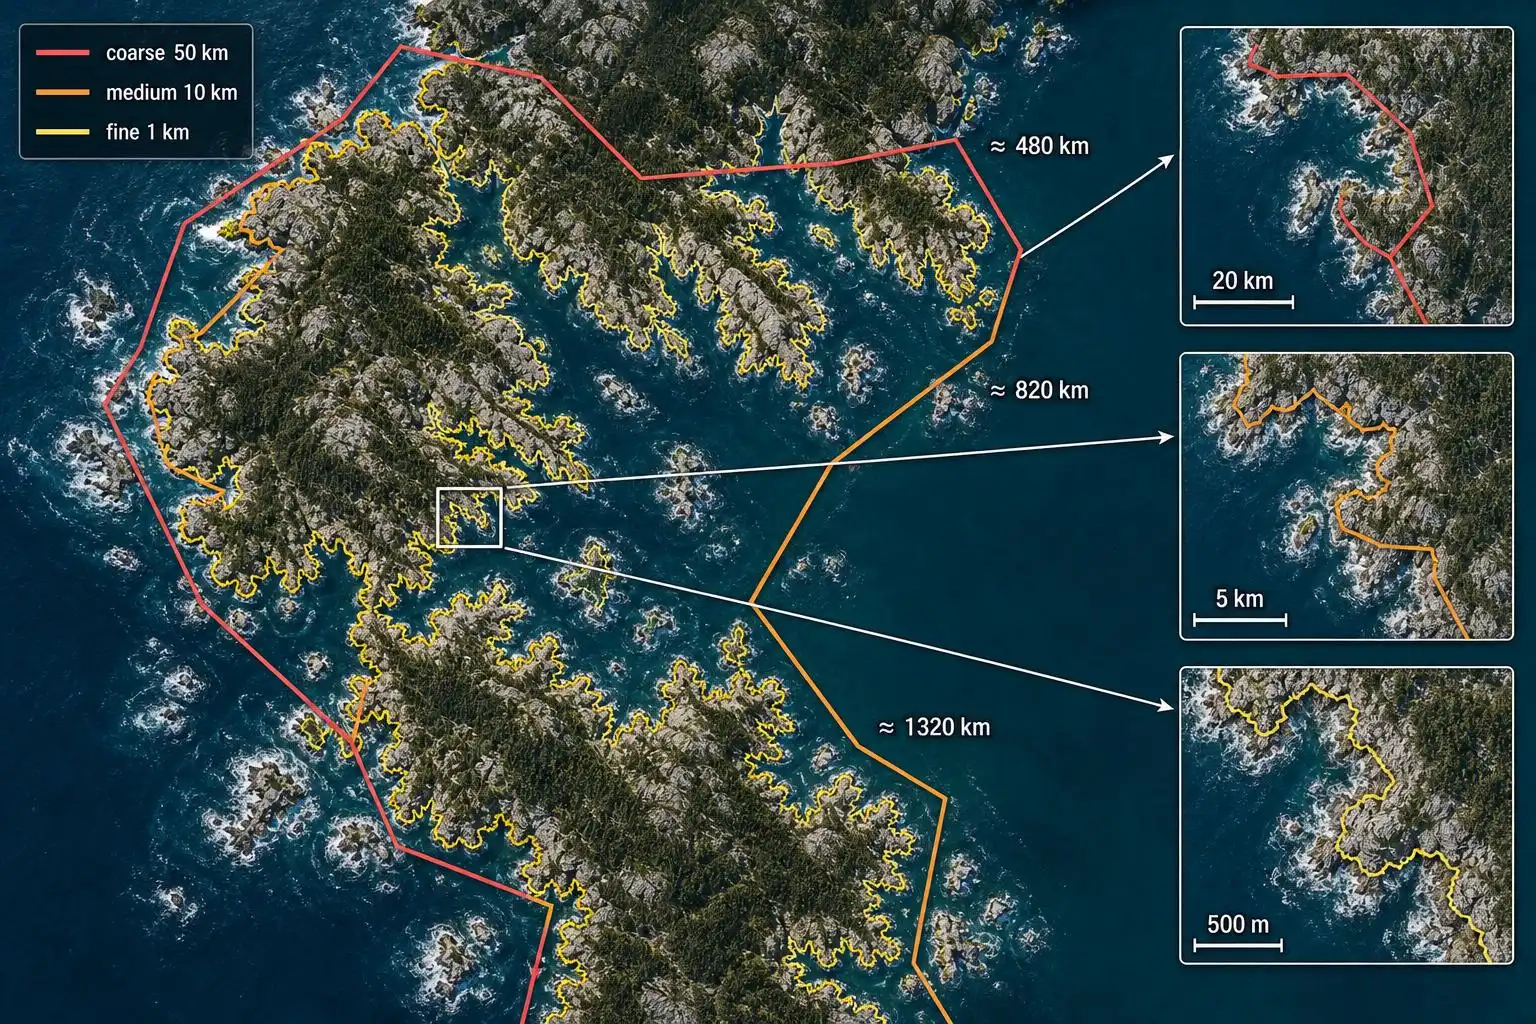
Here’s the core idea. Suppose you measure Britain’s coastline using a ruler 200 kilometers long. You walk this giant ruler along the coast, counting how many steps fit, and multiply. You get some number — say, roughly 2,400 km. Now you switch to a 50 km ruler. It fits into all the nooks the big ruler skipped over, and your total jumps to maybe 3,400 km. Use a 1 km ruler and you’re tracing around individual peninsulas and harbors: perhaps 17,000 km. A 1-meter ruler follows every rock. A 1-centimeter ruler follows every pebble.
Each time you shrink the ruler, you capture more detail, and the total length grows over the scales where the coastline remains jagged. In the mathematical idealization, there is no ruler small enough to “finish” the job, because the coast never smooths out — new complexity appears at every scale. In that idealized limit, as the ruler length approaches zero, the measured length approaches infinity. Real coastlines, however, have physical cutoffs such as grains of rock, erosion, tides, and atoms, so the infinite length is a model rather than a literal measurement.
This is the Coastline Paradox, and it’s not a quirk of Britain specifically. Many natural coastlines show this kind of approximate fractal behavior over limited ranges of scale. So do many mountain ranges, river networks, snowflakes, and bolts of lightning. Nature, it turns out, often prefers a kind of geometry that classical Euclid never imagined.
What Makes a Shape a Fractal?
Classical geometry gives us clean, well-behaved objects. A line is one-dimensional. A square is two-dimensional. A cube is three-dimensional. Dimension, in this world, is always a whole number.
Fractals break that rule.
A fractal is a shape that exhibits self-similarity — it looks roughly the same at every level of magnification — and it has a fractal dimension, which is a number that need not be a whole number at all. A coastline might have a dimension of 1.25. A crumpled piece of paper might have a dimension of 2.5. These shapes are “more than” a line but “less than” a plane, in a precise mathematical sense.
Let’s build one from scratch to see exactly what this means.
Building the Koch Snowflake
Start with an equilateral triangle. Now, on each of the three sides, find the middle third and replace it with two sides of a smaller equilateral triangle pointing outward. You now have a six-pointed star shape. Repeat: take every straight segment, find its middle third, replace it with a triangular bump. Do this forever.
The resulting shape is the Koch Snowflake, invented by the Swedish mathematician Helge von Koch in 1904. It has two remarkable properties that seem to contradict each other:
-
Its perimeter is infinite. At each step, every segment is replaced by four segments each one-third as long. So the total length is multiplied by 4/3 at every step. After n steps, the perimeter is the original length times (4/3)ⁿ. As n → ∞, this grows without bound.
-
Its area is finite. The snowflake never escapes a circle drawn around the original triangle. Each new bump is smaller than the last, and the total area added at every step forms a geometric series that converges to a finite sum. Specifically, if the original triangle has area A, the snowflake’s total area is exactly 8A/5.
A shape with infinite perimeter but finite area. That’s not a paradox — it’s fractal geometry doing exactly what it’s supposed to.
The Dimension That Isn’t a Whole Number
Now, what is the dimension of the boundary of the Koch Snowflake? Here’s the elegant way to think about it.
When you scale a line segment by a factor of 3, you get 3 copies of the original. When you scale a square by a factor of 3, you get 3² = 9 copies. When you scale a cube by a factor of 3, you get 3³ = 27 copies. The pattern is: copies = scale^dimension, or equivalently, dimension = log(copies) / log(scale).
For the Koch Snowflake boundary, when you scale up by a factor of 3, you get exactly 4 copies of the previous shape (that’s how we built it — each segment becomes 4 segments at 1/3 the size). So:
dimension = log(4) / log(3) ≈ 1.2619
The Koch Snowflake’s boundary curve has a dimension of about 1.26. It’s more than a line (dimension 1) but less than a filled-in shape (dimension 2). It’s a curve so crinkled that it occupies more space than a smooth line, but not quite enough to fill an area. That fractional dimension is the mathematical fingerprint of its infinite complexity. The filled snowflake region itself, because it has positive finite area, has dimension 2.
Britain’s coastline, by the same calculation, has a fractal dimension of about 1.25. Norway’s famously fjord-riddled coast clocks in around 1.52. South Africa’s relatively smooth coast is closer to 1.02 — nearly one-dimensional, nearly a smooth curve.
The Mandelbrot Set: Infinite Complexity from a Simple Rule
The most famous fractal of all emerges from an equation so simple it fits on a coffee mug:
z → z² + c
Here’s what that means. Pick any complex number c (complex numbers have a real part and an imaginary part, and can be plotted as points on a plane). Start with z = 0. Square it and add c. Take the result, square it and add c again. Repeat, forever.
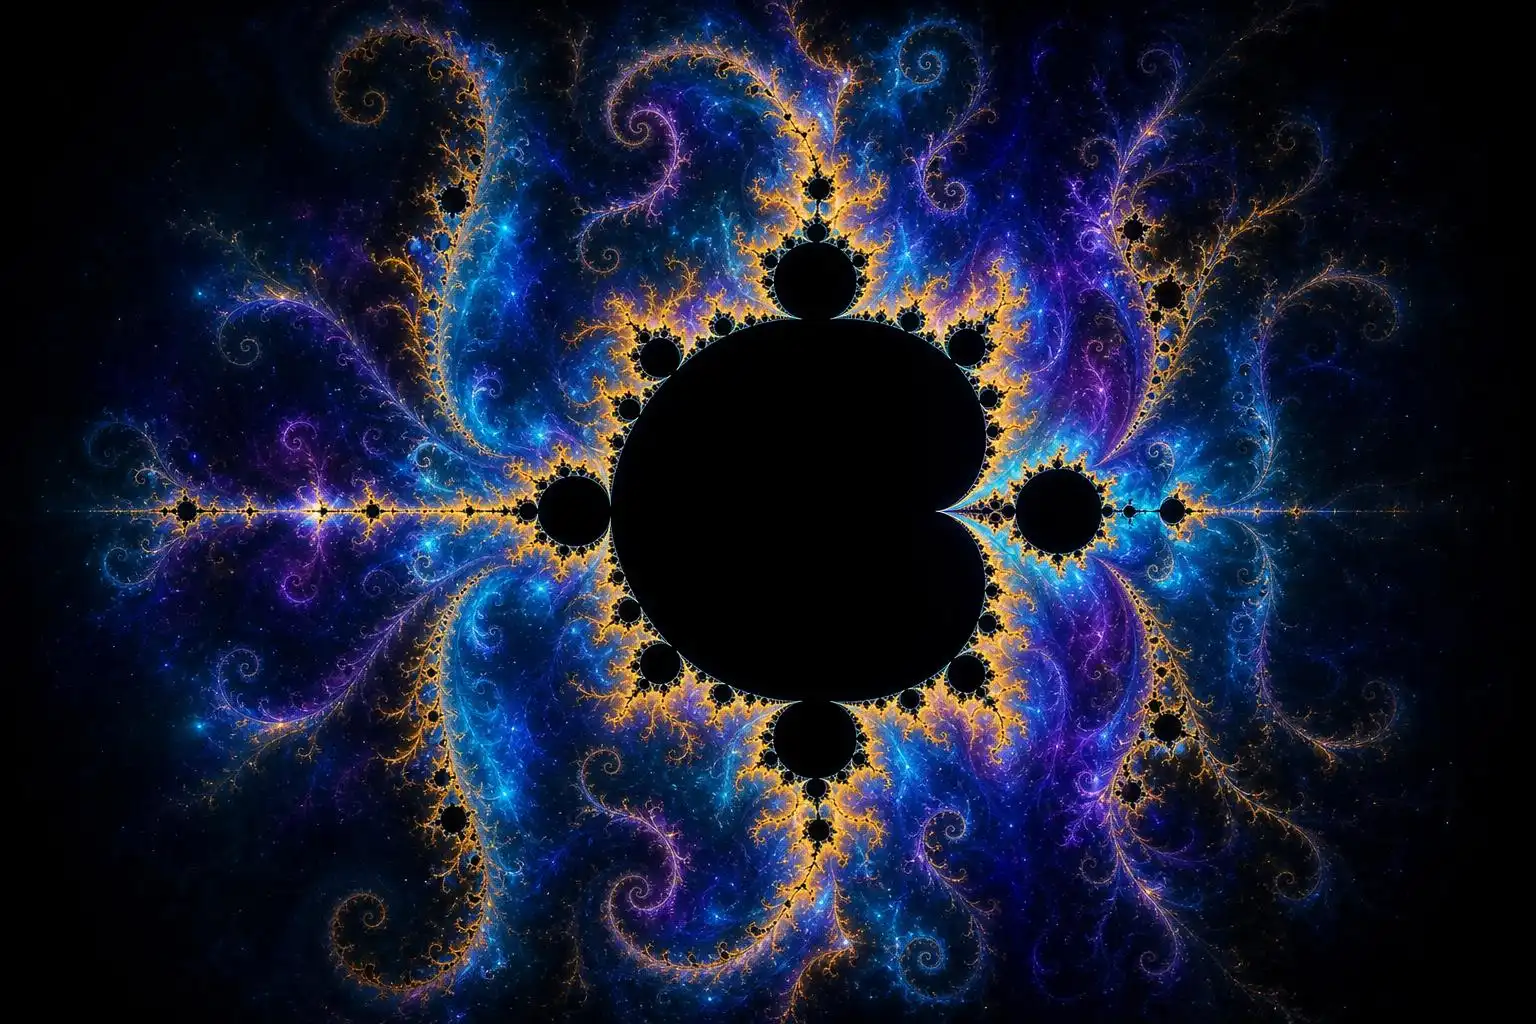
For some values of c, this process stays bounded — the numbers never fly off to infinity. For others, the values explode. The Mandelbrot set is simply the collection of all complex numbers c for which the process stays bounded. Color those points black. Color the outside points according to how quickly they escape to infinity, and you get the iconic image: a lumpy black figure surrounded by an explosion of color.
What makes this astonishing is the boundary of the set. Zoom into any part of the boundary and you find swirling spirals, seahorse tails, and miniature copies of the entire Mandelbrot set, nestled inside themselves at every scale. The rule generating all this complexity has exactly five symbols. The complexity it produces is literally infinite — the boundary of the Mandelbrot set has a fractal dimension of exactly 2, meaning it’s so intricate it almost fills the plane, even though it’s just a curve.
This is perhaps the deepest lesson fractals teach: infinite complexity can arise from perfectly simple rules, applied repeatedly.
Where Fractals Live in the Real World
This isn’t just abstract art. Fractal geometry turns out to be the right language for describing a huge portion of the natural world.
Trees and lungs. A tree branches, and each branch branches, and each twig branches — self-similar over many scales. Your lungs use the same trick: the bronchial tree branches about 23 times, packing roughly 70 square meters of gas-exchange surface into a space the size of a football. A smooth-walled lung would have perhaps 0.1 square meters. Fractal branching multiplies surface area by a factor of 700, without requiring a body the size of a house.
Blood vessels and river networks. The circulatory system fans out from the aorta to capillaries 10,000 times thinner, following fractal branching rules that minimize the energy needed to pump blood. River systems look almost identical from the air, following what’s known as Horton’s laws — mathematical self-similarity across scales from streams to great rivers.
Earthquakes. The Gutenberg-Richter law says that for every magnitude-7 earthquake, there are roughly 10 magnitude-6 quakes, 100 magnitude-5 quakes, and so on. This power-law relationship is the statistical signature of a fractal process — the fault systems that generate earthquakes are themselves fractal networks.
Financial markets. Mandelbrot himself spent decades applying fractal geometry to stock prices, arguing that standard financial models badly underestimate the frequency of extreme price swings. The reason: price changes over time can show statistical self-similarity — daily charts can look eerily like minute-by-minute charts or yearly charts. Markets are not always smooth, well-behaved Gaussian processes. Fractal and multifractal models capture some of their rough statistical features, and can account for crashes more often than classical models do.
A Worked Example: The Sierpiński Triangle
Let’s do one more concrete construction, because the numbers are so satisfying.
Start with a filled equilateral triangle. Remove the central triangle formed by connecting the midpoints of the three sides. You now have three smaller triangles. Remove the central triangle from each of those. Repeat forever.
The result is the Sierpiński Triangle. What’s its area? At each step, you remove 1/4 of the remaining area. After n steps, the fraction of area remaining is (3/4)ⁿ. As n → ∞, this approaches 0. The Sierpiński Triangle has zero area — it’s been riddled with so many holes that nothing solid remains.
And yet it’s not empty. It contains infinitely many points — a whole, intricate, self-similar structure. It’s more than a collection of isolated dots (dimension 0) but less than a filled triangle (dimension 2). Its fractal dimension:
dimension = log(3) / log(2) ≈ 1.585
A shape with no area but dimension 1.585. Classical geometry simply has no category for this. Fractal geometry was built precisely to hold it.
The Usable Insight
Here’s the mental model to carry away: roughness is not just a qualitative description — it’s a measurable quantity, and that quantity is the fractal dimension.
When scientists measure the fractal dimension of a tumor’s boundary, they can predict how aggressively it will grow. When engineers measure the fractal dimension of a metal’s fractured surface, they can infer how the break occurred. When ecologists measure the fractal dimension of a habitat’s edge, they can estimate how many species it will support. When seismologists measure the fractal dimension of fault networks, they can model earthquake risk.
In every case, the key insight is the same one Mandelbrot extracted from a question about coastlines: the geometry of natural complexity is not an accident or a mess to be averaged away. It is information. The jaggedness, the branching, the self-similarity across scales — these are the signal, not the noise.
Next time you look at a coastline, a tree, a bolt of lightning, or a head of broccoli (which is approximately fractal — zoom into a floret and you find a miniature broccoli), you’re looking at a shape that classical geometry cannot describe but fractal geometry handles with a single elegant number. The universe, it seems, has a favorite dimension — and it’s rarely a whole one.


Leave a Reply