


Suppose you want to know which of two proposals a country prefers. Asking everyone would settle the question, but it would take enormous time and money. Asking 1,000 people sounds almost comically inadequate. How could such a tiny fraction tell you anything about millions of voters?
The surprising answer is that, if people are selected at random, the size of the sample matters far more than the size of the country. The mathematics is not magic: it comes from what happens when many small, unpredictable answers are averaged together.
Start with a jar of unknown contents
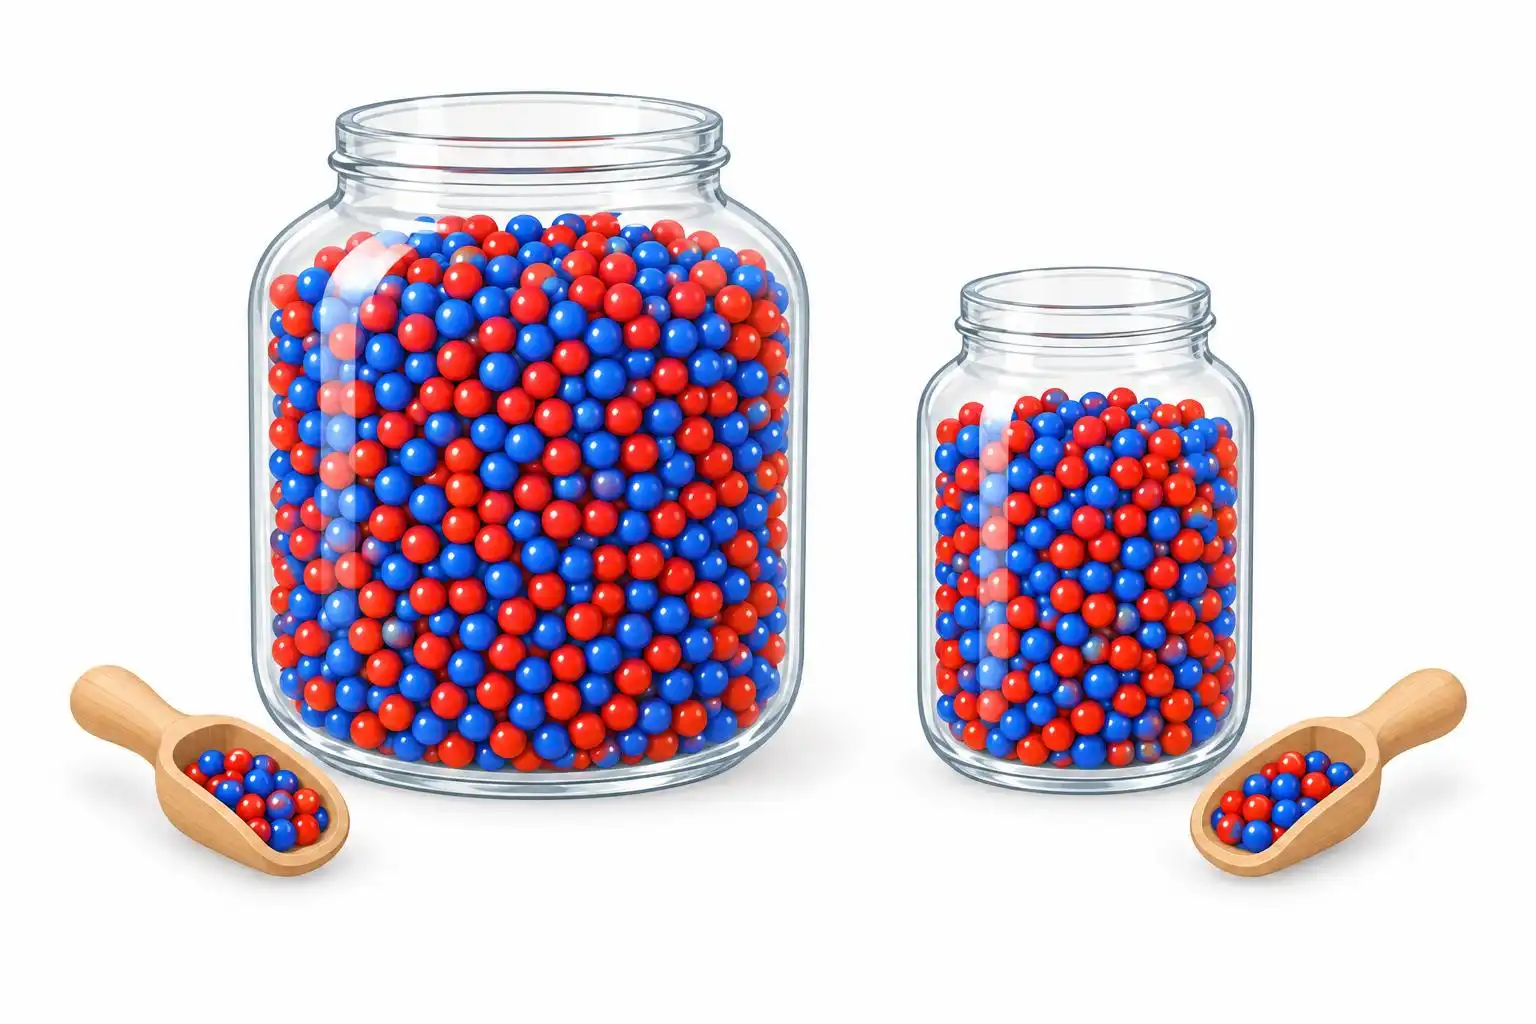
Imagine a huge jar of red and blue beads. You cannot see inside, but you can draw beads, record their colors, and put them back. The proportion of red beads in your draws is an estimate of the proportion in the jar. A poll works similarly: each person’s answer is one observation, and the percentage supporting a proposal is the estimate.
If half the beads are red, any single draw is maximally uncertain. Drawing red counts as 1 and blue as 0, so the average of your draws is the fraction that came up red. Repeated samples of 1,000 draws will not all produce exactly 50%. Some will produce 48%, others 52%. The question is how much that average typically wanders.
Why the uncertainty shrinks with a square root
For a yes-or-no question, let p be the true share answering yes and n the number of independent, randomly selected answers. The typical size of the sample’s error, called its standard error, is √[p(1 − p)/n]. You do not need to memorize the expression to see its key feature: uncertainty falls as the square root of the sample size rises.
Why a square root? If you add up independent answers, the unpredictable part of the total grows roughly like √n, while the total number of answers grows like n. Divide to get an average, and its unpredictable part is therefore about √n/n, or 1/√n. Each extra answer helps, but the gains get smaller as the sample grows.
This gives a useful rule of thumb: to cut sampling uncertainty in half, you need four times as many answers, not twice as many.
What 1,000 answers can tell you
Suppose a random sample of 1,000 voters finds 500 in favor. For a 50–50 split, the standard error is √(0.5 × 0.5 / 1,000), or about 0.0158: roughly 1.6 percentage points. Multiplying by about 2 gives 3.2 percentage points. Using the more precise multiplier 1.96 gives 3.1 points, the familiar approximate 95% margin of error.
So a poll reporting 50% support might give a 95% confidence interval of about 46.9% to 53.1%. This does not mean there is a 95% chance that this particular interval contains the true share. The true share is fixed, though unknown. Rather, if we repeatedly took random samples and built intervals this way, about 95% of those intervals would contain it.
Now imagine surveying 4,000 voters. The standard error becomes √(0.25 / 4,000), or about 0.8 points; the approximate 95% margin becomes 1.5 points. Four times the interviews bought about half the sampling error.
Why the country’s population barely enters
Whether the jar holds a million beads or a billion, 1,000 independent draws tell you about the proportion of red beads with roughly the same precision. Likewise, a well-drawn sample of 1,000 people can estimate a percentage in a large city or a large country with a similar sampling margin of error.
Real pollsters generally do not sample the same person twice, so the draws are not perfectly independent. But when 1,000 people are a tiny fraction of the population, that difference is negligible. If you sampled a substantial fraction of a small town instead, knowing who had already answered would reduce the remaining uncertainty. In that case, population size would matter.
The catch: random is doing important work
The 3.1-point calculation describes random sampling error, not every way a poll can go wrong. If a survey misses people without internet access, or if one group is much less likely to respond, a large sample can still lean the wrong way. Asking 100,000 visitors to one website does not automatically beat a carefully selected sample of 1,000 voters.
The headline margin also applies to the full sample, not automatically to smaller groups within it. If only 250 respondents belong to the group you want to examine, a 50–50 result for that group has an approximate 95% sampling margin of √(0.25 / 250) × 1.96, or 6.2 points—about twice as wide.
When you next see a poll, look beyond the national population and ask two questions: How many people answered, and how were they chosen? Sample size tells you how much random wobble to expect. The method of selection tells you whether that calculation deserves your trust.


Leave a Reply
You must be logged in to post a comment.