

Imagine you’re planning a road trip and you want to visit seven cities without backtracking. Or picture a city engineer trying to figure out whether every neighborhood can be reached from every other one after a bridge washes out. Or think about how Netflix decides which movie to recommend next, or how a virus spreads through a school. These problems look completely different on the surface. Underneath, they are all the same problem — and graph theory is the language that describes it.
Graph theory is one of those beautiful corners of mathematics that feels almost too simple at first, then quietly reveals itself to be one of the most powerful tools humans have ever invented.
What Is a Graph, Really?
In everyday English, a “graph” usually means a bar chart or a plotted curve. In mathematics, it means something different: a collection of dots (called vertices or nodes) connected by lines (called edges). That’s it. No axes, no coordinates, no equations. Just dots and lines.
A graph is a way of encoding relationships. Each vertex represents a thing — a city, a person, a webpage, a router — and each edge represents a connection between two things. Whether those things are physically close or far apart is irrelevant. What matters is: are they connected, or aren’t they?
Here’s a tiny example. Suppose you have four people: Alice, Bob, Carmen, and Dmitri. Alice knows Bob. Bob knows Carmen. Carmen knows Dmitri. Dmitri knows Alice. Alice and Carmen have never met. Bob and Dmitri have never met. Draw a dot for each person and a line between every pair that knows each other. You get a square — four vertices, four edges, forming a cycle. That simple picture already tells you something: to get a message from Alice to Carmen, it has to pass through at least one intermediary.
The Bridge Problem That Started It All
Graph theory was born in 1736 from a puzzle about bridges.
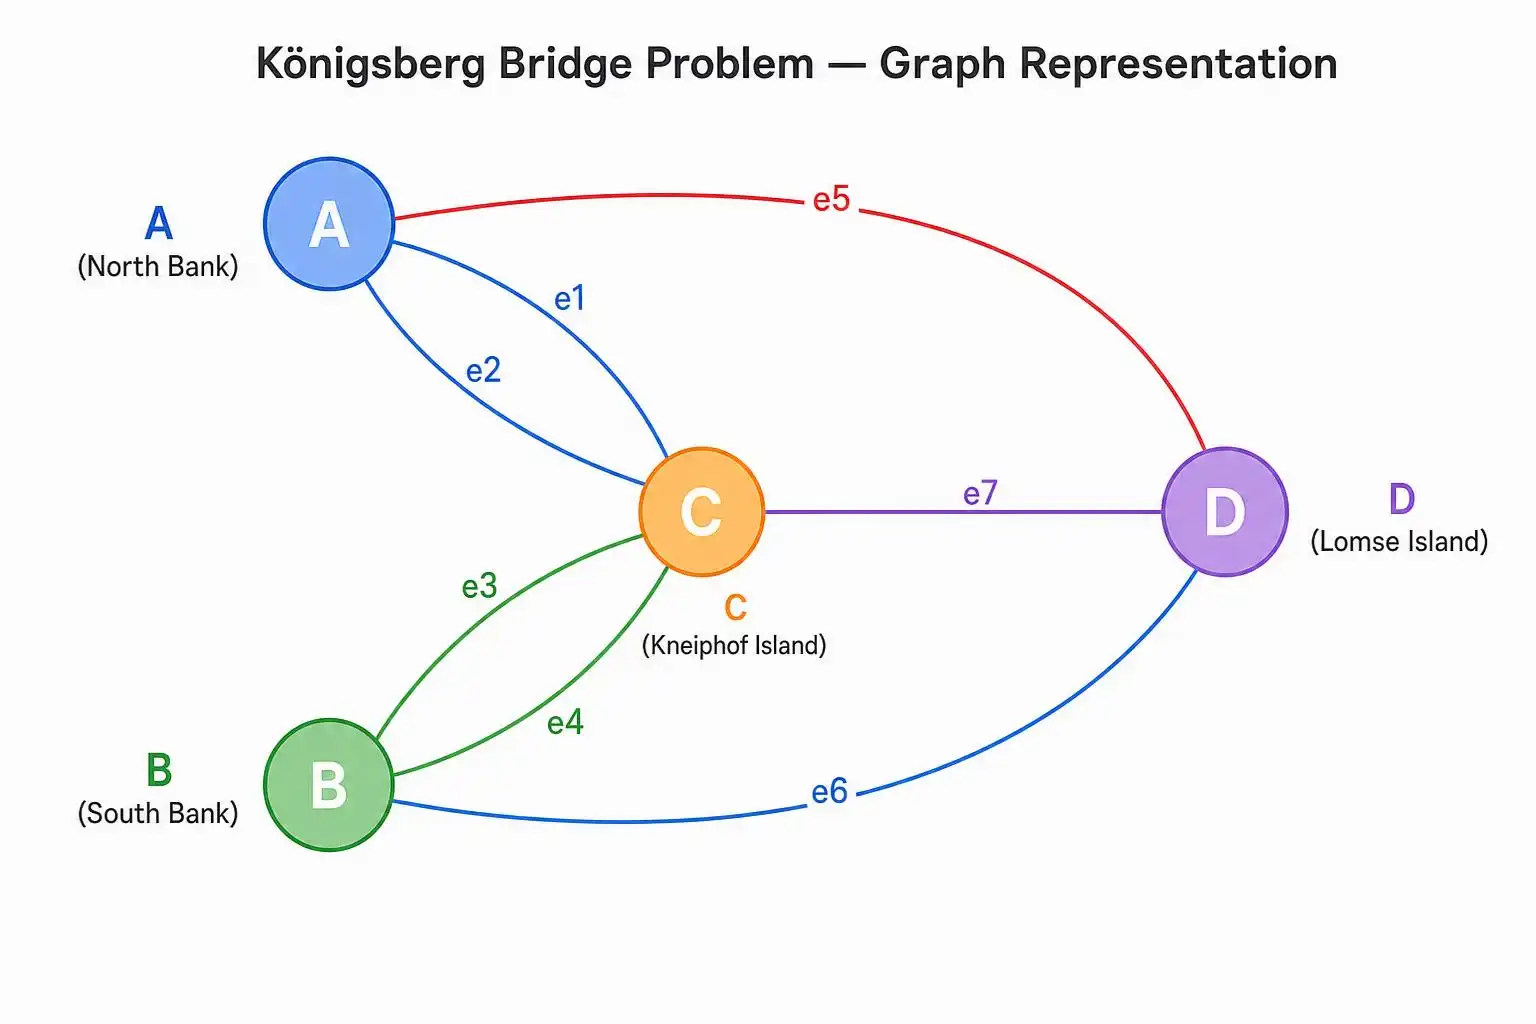
The city of Königsberg (now Kaliningrad, Russia) sat on the Pregel River, which split around two islands. Seven bridges connected the islands and riverbanks to each other. The citizens of Königsberg loved to stroll on Sundays, and a popular question arose: is it possible to walk through the city crossing each bridge exactly once?
People tried for years. Nobody could do it, but nobody could prove it was impossible — until the Swiss mathematician Leonhard Euler stepped in.
Euler’s insight was to strip away everything irrelevant. It doesn’t matter how wide the river is, how long the bridges are, or what the city looks like. All that matters is: which landmasses are connected to which? He replaced each landmass with a vertex and each bridge with an edge. The question became: can you trace a path through this graph that uses every edge exactly once?
Euler proved that such a path — now called an Eulerian path — exists if and only if the graph is connected, aside from isolated vertices, and has exactly zero or two vertices with an odd number of edges attached to them. (The number of edges at a vertex is called its degree.) In Königsberg, all four vertices had odd degree, so the walk was impossible. Not merely difficult. Impossible, by mathematical necessity.
This was the first theorem in graph theory, proved almost 300 years ago, and it remains one of the most satisfying arguments in all of mathematics: a hard real-world puzzle dissolved by the right abstraction.
Paths, Cycles, and Connectivity
Let’s build up a little vocabulary, because the concepts are genuinely useful.
A path is a sequence of vertices where each consecutive pair is connected by an edge, and no vertex is visited twice. A cycle is a path that starts and ends at the same vertex. A graph is connected if there is a path between every pair of vertices — meaning you can get from anywhere to anywhere.
Connectivity is surprisingly deep. When a graph is not connected, it breaks into separate components — isolated islands with no edges between them. Engineers who design power grids, internet backbones, or airline networks obsess over connectivity: if one node fails, does the network fall apart, or does traffic reroute? The answer depends on the graph’s structure.
Some vertices matter more than others. A bridge in a graph is a single edge whose removal disconnects the graph. An articulation point is a single vertex whose removal disconnects the graph. Finding these fragile points is critical for infrastructure resilience — and it’s a purely graph-theoretic calculation.
The Six Degrees of Separation (With Real Numbers)
You’ve probably heard the claim that any two people on Earth are connected by a short chain of acquaintances. This is a statement about the average shortest-path length of the human social graph — the typical shortest path between two vertices — not its diameter, which is the longest shortest path.
The original 1967 experiment by sociologist Stanley Milgram asked random people in Nebraska to forward a letter to a target person in Boston using only personal acquaintances. Letters that arrived took an average of 5.5 steps. Six degrees of separation entered the cultural lexicon.
In graph terms: the human social network has roughly 8 billion vertices. Each person knows, on average, a few hundred people. And yet the average shortest-path length of this graph appears to be only a handful of steps. How is that possible?
The answer lies in a concept called a small-world network. Most of your friends know each other — your social graph is locally clustered. But occasionally you know someone who moves in completely different social circles: a college roommate who became a diplomat, a cousin who works in a remote industry. These long-range edges act as shortcuts that dramatically shrink typical path lengths across the whole network.
Mathematicians Watts and Strogatz formalized this in 1998. Start with a regular ring lattice (everyone knows their nearest neighbors) and randomly “rewire” just a small fraction of edges to point somewhere far away. The clustering barely changes, but the typical path length collapses from enormous to tiny. A few random bridges are enough to make the world small.
Facebook published a study in 2016 finding the average distance between any two of its 1.6 billion users was 4.57 — not six, but four and a half. The world has gotten smaller as the network has grown denser.
A Concrete Example: Finding the Shortest Route
Let’s do some real math. Suppose you’re a delivery driver with five stops: a warehouse (W) and four customers — A, B, C, D. The travel times in minutes between locations are:
- W → A: 10, W → B: 15, W → C: 20
- A → B: 8, A → C: 12, A → D: 25
- B → C: 6, B → D: 18
- C → D: 10
You want the fastest route from W to D. This is the shortest path problem, and the go-to algorithm is Dijkstra’s algorithm, invented by Dutch computer scientist Edsger Dijkstra in 1956.
Here’s how it works. You keep a running “best known time” to reach each vertex, starting at infinity for everyone except W (which is zero). At each step, you visit the unvisited vertex with the smallest known time and update its neighbors.
- Start: W = 0, A = ∞, B = ∞, C = ∞, D = ∞
- Visit W: update A = 10, B = 15, C = 20
- Visit A (cheapest unvisited, cost 10): update B = min(15, 10+8) = 15, C = min(20, 10+12) = 20, D = min(∞, 10+25) = 35
- Visit B (cost 15): update C = min(20, 15+6) = 20, D = min(35, 15+18) = 33
- Visit C (cost 20): update D = min(33, 20+10) = 30
- Visit D (cost 30): done.
The shortest path to D takes 30 minutes, going W → C → D. The route W → A → B → C → D would take 10 + 8 + 6 + 10 = 34 minutes. But the algorithm finds the shortest route systematically and would scale to thousands of nodes without breaking a sweat. Google Maps runs a souped-up version of this millions of times per second.
How Google Ranks the Web: PageRank
The internet is a graph. Pages are vertices; hyperlinks are directed edges (an arrow from page A to page B means A links to B). When Google launched in 1998, its founders Larry Page and Sergey Brin asked: which pages are most important?
Their answer was PageRank — an algorithm that assigns each page a score based on how many other pages link to it, weighted by their scores. A link from a highly-ranked page counts more than a link from an obscure one. Mathematically, this is an eigenvector problem: you’re looking for a stable distribution where each page’s score is proportional to the sum of scores flowing into it.
But the intuition is pure graph theory: importance propagates along edges. A vertex matters if important vertices point to it. This recursive definition, once you work out the linear algebra, converges to a unique answer — and it transformed how the world finds information.
Coloring Maps (And Scheduling Exams)
Here’s a classic graph theory problem with a surprising answer. Suppose you’re drawing a map and you want neighboring regions to have different colors. What’s the minimum number of colors you need?
In 1852, Francis Guthrie conjectured that four colors are always enough, no matter how complicated the map. This became the Four Color Theorem, one of the most famous problems in mathematics. It wasn’t proved until 1976 — and the proof required a computer to check 1,936 special cases, making it the first major theorem proved with computer assistance.
The graph connection: replace each region with a vertex and draw an edge between two vertices if their regions share a border. Coloring the map so neighbors differ is exactly graph coloring — assigning colors to vertices so no two adjacent vertices share a color. The minimum number of colors needed is called the chromatic number of the graph.
Graph coloring shows up everywhere outside of cartography. University exam scheduling is a graph coloring problem: courses are vertices, and two courses share an edge if any student is enrolled in both. Assigning time slots so no student has two exams at once is exactly finding a proper coloring. Wireless networks use it to assign frequencies to towers so nearby towers don’t interfere. Sudoku is a graph coloring problem in disguise.
The Traveling Salesman: A Problem That Humbles Computers
We’d be remiss not to mention the most famous unsolved (in a practical sense) problem in graph theory: the Traveling Salesman Problem, or TSP.
A salesman needs to visit n cities, each exactly once, and return home. What’s the shortest possible route?
For small n, you can try all routes. But the number of possible routes grows as (n−1)!/2. For 10 cities, that’s 181,440 routes — manageable. For 20 cities, it’s over 60 quadrillion. For 100 cities, the number of routes exceeds the number of atoms in the observable universe.
No one has found an efficient algorithm that always finds the perfect answer for large inputs — and most computer scientists believe none exists. TSP belongs to a class of problems called NP-hard, where no polynomial-time exact algorithm is known; finding one for TSP would have major consequences, such as proving P = NP. But clever approximation algorithms can find routes within a guaranteed percentage of optimal, and that’s often good enough. Circuit board manufacturers, logistics companies, and DNA sequencing labs use TSP approximations every day.
The One Idea to Carry Away
Graph theory’s superpower is abstraction with purpose. The moment you recognize that your problem is really about vertices and edges — that cities and bridges, people and friendships, webpages and links, and courses and conflicts are all the same mathematical object — you gain access to centuries of results and algorithms, ready to use.
The back-of-the-envelope move to practice: next time you face a scheduling conflict, a routing puzzle, or a question about who’s connected to whom, try drawing the dots and lines. Sketch the graph. Ask: is it connected? What are the degrees? Are there any obvious bridges or bottlenecks? Often, just drawing the graph reveals the answer before you’ve written a single equation.
The world is full of hidden graphs. Once you learn to see them, you can’t unsee them — and that’s exactly the kind of vision that turns a hard problem into a solved one.


Leave a Reply