
There’s a moment in every viral video’s life — somewhere between “my friend sent me this” and “it’s on the evening news” — where the numbers go from modest to staggering so fast it feels like magic. One day a clip has 10,000 views. Three days later it has 10 million. What happened?
The answer is one of the most powerful — and most misunderstood — ideas in all of mathematics: exponential growth. It shows up in viral videos, yes, but also in compound interest (which we explored a few weeks ago), in the spread of epidemics, in the doubling of computing power, and in the quiet, terrifying arithmetic of debt. Once you see it clearly, you’ll never look at a graph the same way again.
The Difference Between Adding and Multiplying
Let’s start with the simplest possible contrast.
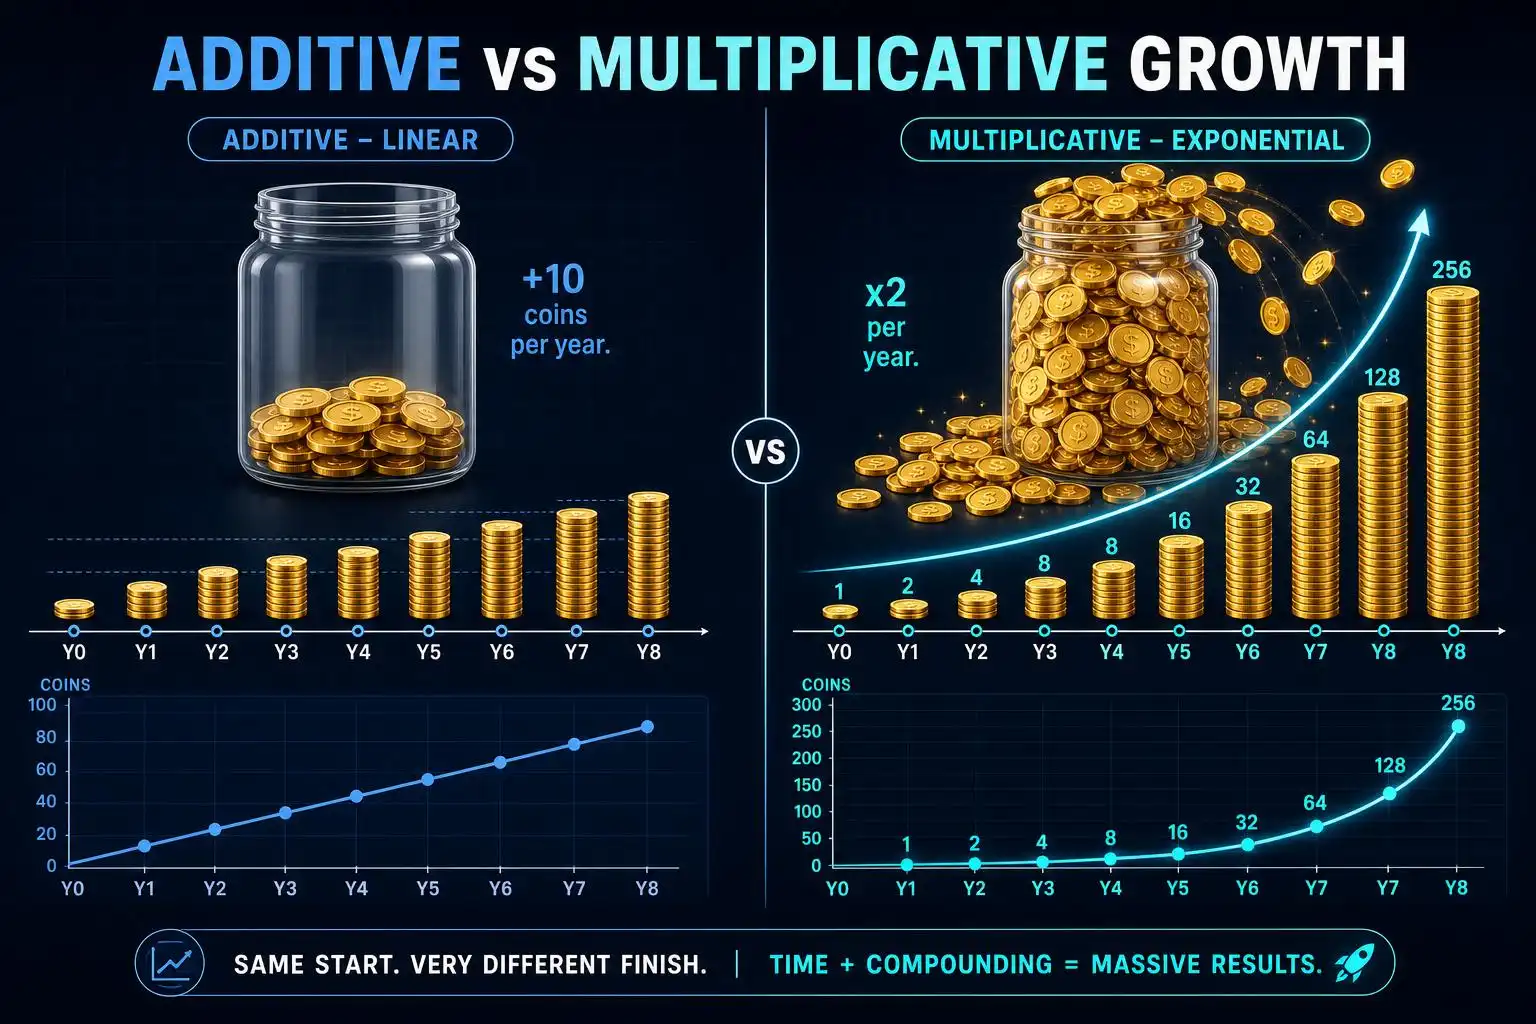
Imagine you earn a $1,000 bonus every year and put it in a jar. After 10 years you have $10,000. After 30 years, $30,000. The amount grows, but it grows by the same fixed chunk each time. Mathematicians call this linear growth, and if you graphed it, you’d get a perfectly straight line slanting upward.
Now imagine instead that you start with $1,000 and it doubles every year. After year 1 you have $2,000. After year 2, $4,000. After year 3, $8,000. After 10 years? $1,024,000. After 30 years? Over a billion dollars.
Same starting point. Same word, “grows.” Completely different universe of outcomes.
The second scenario is exponential growth. The defining feature isn’t that things get big — it’s how they get big. In linear growth, you add the same amount each step. In exponential growth, you multiply by the same factor each step. That single word — multiply instead of add — is what separates a jar of cash from a billion dollars.
The Formula, Gently Unpacked
The mathematical expression for exponential growth is:
N(t) = N₀ × rᵗ
Let’s decode each piece:
- N(t) is the quantity at time t (the number of views, dollars, or infected people at a given moment).
- N₀ is the starting quantity (the “initial condition” — how many you had at time zero).
- r is the growth factor — the number you multiply by at each step. If something doubles, r = 2. If it grows by 50% each step, r = 1.5. If it grows by 10%, r = 1.1.
- t is the number of time steps (days, years, generations — whatever unit makes sense).
Notice where t lives: it’s the exponent, the little superscript number. That’s why it’s called exponential growth. The variable you care about — time — is up in the power position. And as any algebra student knows, exponents make numbers explode.
A Viral Video, By the Numbers
Let’s work through a real scenario with real arithmetic.
Suppose a video gets posted on a Monday morning with 100 views. It’s genuinely funny — the kind of clip people feel compelled to share. Let’s say, on average, every person who watches it sends it to two friends who haven’t seen it, and that cycle repeats every day. So the growth factor is r = 3 (the original viewers plus two new ones each), and we start with N₀ = 100.
Here’s what the next two weeks look like:
| Day | Views that day | Formula |
|---|---|---|
| 0 | 100 | 100 × 3⁰ |
| 1 | 300 | 100 × 3¹ |
| 2 | 900 | 100 × 3² |
| 3 | 2,700 | 100 × 3³ |
| 5 | 24,300 | 100 × 3⁵ |
| 7 | 218,700 | 100 × 3⁷ |
| 10 | 5,904,900 | 100 × 3¹⁰ |
| 14 | 478,296,900 | 100 × 3¹⁴ |
By day 14, nearly half a billion views — from a humble 100. No single day’s jump is shocking on its own; it’s always “just” tripling. But tripling, compounded over two weeks, is civilization-altering.
This is the psychological trap of exponential growth. Our brains evolved to think linearly. We’re wired to extrapolate “it’s been growing by X, so it’ll keep growing by X.” Exponential growth violates that intuition at every turn.
The Magic Number: Doubling Time
One of the most useful mental tools for reasoning about exponential growth is the concept of doubling time — how long does it take for the quantity to double?
If your growth factor per day is r, the doubling time (in days) is:
T₂ = log(2) / log(r)
where “log” is the logarithm — the mathematical operation that undoes exponentiation, asking “what power do I need?” (We’ll do a full article on logarithms another time, but for now, just know your calculator has a “log” button.)
For our viral video with r = 3:
T₂ = log(2) / log(3) ≈ 0.693 / 1.099 ≈ 0.63 days
The video is doubling in size roughly every 15 hours. That’s why it hits half a billion in two weeks.
There’s also a beautiful shortcut called the Rule of 70: divide 70 by the percentage growth rate to get the approximate doubling time. If something grows 7% per year, it doubles in roughly 70 ÷ 7 = 10 years. If it grows 2% per year, it doubles in about 35 years. This rule is accurate enough for most back-of-the-envelope calculations and is used constantly by economists, epidemiologists, and investors.
The Same Math, A Darker Stage
In early 2020, a new virus began spreading through human populations. Epidemiologists tracked a number called R₀ (pronounced “R-naught”) — the average number of people each infected person goes on to infect, assuming no immunity in the population.
Early estimates for a particular respiratory virus put R₀ somewhere between 2 and 3.
Sound familiar? That’s exactly our viral video scenario, except the “views” are infections and the “days” are serial intervals (the average time between one person getting infected and them infecting others — roughly 4–7 days for many respiratory illnesses).
With R₀ = 2.5 and a 5-day serial interval:
- Day 0: 1 case
- Day 5 (interval 1): ~2.5 cases
- Day 10 (interval 2): ~6 cases
- Day 15 (interval 3): ~16 cases
- Day 30 (interval 6): ~244 cases
- Day 45 (interval 9): ~3,800 cases
- Day 60 (interval 12): ~59,600 cases
Starting from a single case, two months of unchecked exponential growth produces tens of thousands of cases. Four months produces millions. This is not a prediction — it’s arithmetic. The math doesn’t care whether it’s tracking laughs or suffering.
This is why epidemiologists fixate so intensely on R₀. The goal of interventions — masks, distancing, vaccines — is to push the effective reproduction number (Rₑ) below 1. When each infected person infects fewer than one person on average, the growth factor drops below 1, and the exponent works in reverse: the epidemic shrinks exponentially instead of growing. That threshold, Rₑ = 1, is the mathematical boundary between a spreading epidemic and a dying one.
Exponential Decay: The Same Engine, Running Backward
When r is less than 1, the formula N(t) = N₀ × rᵗ describes exponential decay — things shrinking by a fixed proportion each step instead of growing.
A classic example: radioactive decay. Carbon-14 is an unstable isotope that loses half its atoms every 5,730 years (its “half-life”). If you find an ancient bone with 25% of the carbon-14 you’d expect in a living organism, you know it’s been through two half-lives — roughly 11,460 years old. That’s the backbone of radiocarbon dating: the same exponential formula, just with r = 0.5 and t measured in 5,730-year chunks.
Drug concentrations in your bloodstream decay exponentially too. If a medication has a half-life of 4 hours, and you take a 200mg dose, here’s what’s left:
| Hours after dose | Amount remaining |
|---|---|
| 0 | 200 mg |
| 4 | 100 mg |
| 8 | 50 mg |
| 12 | 25 mg |
| 16 | ~12.5 mg |
| 24 | ~3.1 mg |
This is why doctors prescribe medications every 8 or 12 hours — they’re working with the drug’s exponential decay curve to keep concentrations in the therapeutic range.
Why Exponential Growth Always Hits a Wall
Here’s the thing about exponential growth in the real world: it never lasts forever. The viral video runs out of people who haven’t seen it. The epidemic runs out of susceptible hosts (or encounters immunity). The bacteria in a petri dish run out of nutrients.
Real growth curves are almost never pure exponentials — they’re S-curves (logistic curves), which start with exponential growth, then slow as resources or susceptible populations deplete, and finally flatten into a plateau. The exponential phase is just the early, unconstrained chapter.
But here’s why the exponential model still matters enormously: the early phase is where decisions count most. Whether you’re a public health official deciding when to issue a warning, an investor deciding when to get in (or out), or a content creator deciding when to push a post, the exponential phase is when small actions have the largest consequences. Acting when the numbers are still small — when the growth looks “not that bad yet” — is almost always the right call, because the math is about to make “not that bad” look quaint.
Your One Usable Insight
Here is the mental model to carry forward: whenever something grows by a fixed percentage — not a fixed amount, but a fixed percentage — you are dealing with exponential growth, and the Rule of 70 tells you how fast it doubles.
Population growing at 2% per year? Doubles in 35 years. Credit card balance accruing 20% annual interest? Doubles in 3.5 years. A social media account growing 10% per week? Doubles in 7 weeks, quadruples in 14, grows 16-fold in 28 weeks.
The numbers are neutral. They don’t care whether they’re working for you or against you. But once you can spot the pattern — once you hear “grows by X percent” and immediately think “doubling time” — you’ve got a lens that cuts through the noise of almost every news story, financial decision, and health headline you’ll ever encounter.
That’s not a small thing. That’s one of the most powerful quantitative intuitions a person can own.


Leave a Reply