
Imagine your doctor calls with news: a screening test came back positive for a rare disease. Your heart sinks. The test, she tells you, is 99% accurate. Surely that means you almost certainly have the disease, right?
Not necessarily. In fact, depending on how rare the disease is, there’s a good chance you’re perfectly healthy — even with that seemingly airtight 99% accuracy. This counterintuitive result is one of the most practically important ideas in all of probability, and understanding it could genuinely change how you interpret medical news, news headlines, and everyday statistics for the rest of your life.
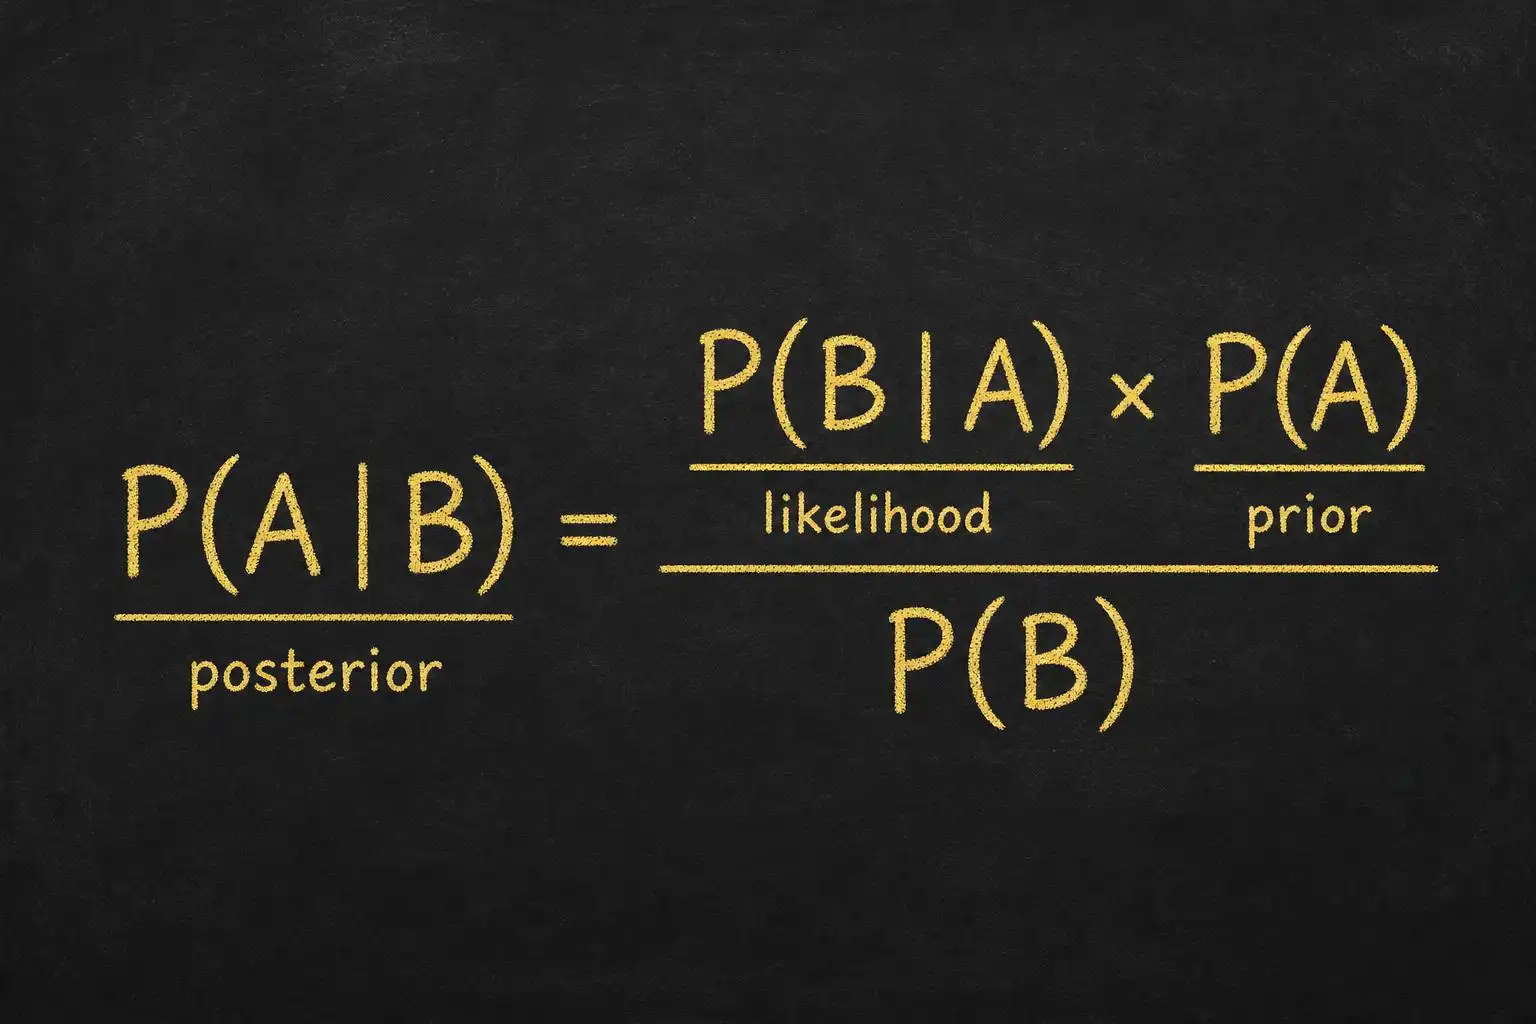
The key is a more than 260-year-old formula called Bayes’ Theorem.
Setting the Stage: What “Accurate” Actually Means
Before we can understand Bayes’ Theorem, we need to unpack what it means for a test to be “accurate.” Medical tests actually have two separate accuracy numbers, and conflating them is the root of all the confusion.
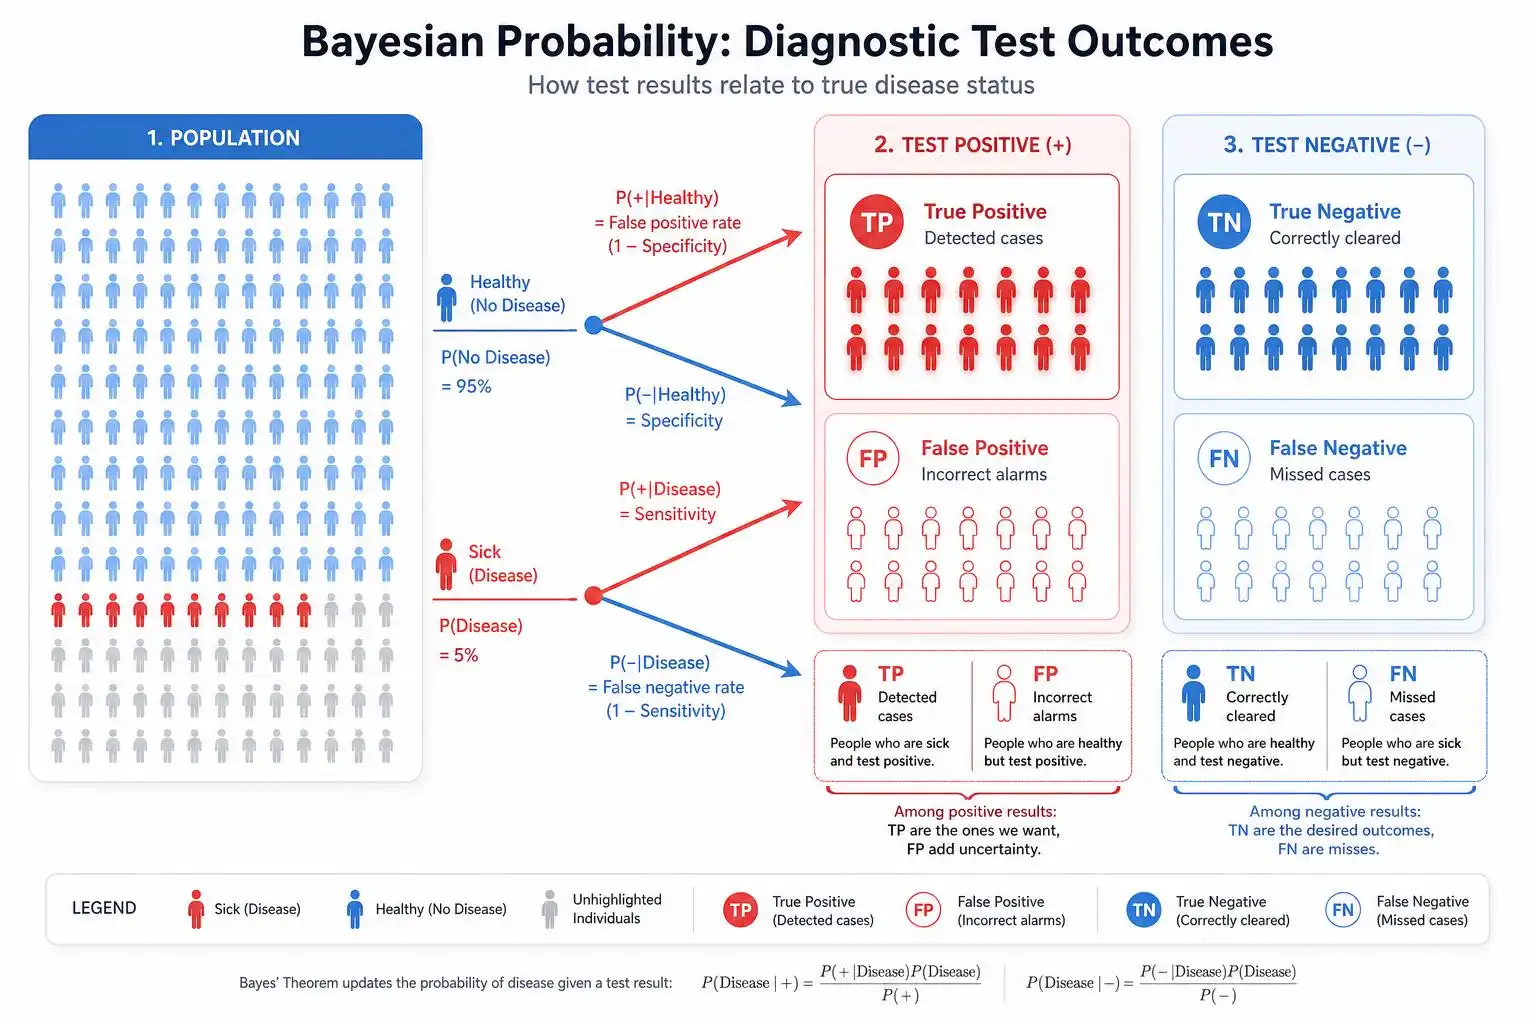
Sensitivity (also called the true positive rate) is the probability that the test returns positive given that you actually have the disease. A sensitivity of 99% means: if 100 sick people take the test, about 99 of them will correctly test positive.
Specificity (also called the true negative rate) is the probability that the test returns negative given that you don’t have the disease. A specificity of 99% means: if 100 healthy people take the test, about 99 of them will correctly test negative — but about 1 will get a false positive.
Both numbers sound excellent. So what’s the problem?
The problem is a third number that most people forget to include: prevalence — how common the disease actually is in the population being tested.
A Worked Example: The Rare Disease
Let’s make this concrete. Suppose:
- The disease affects 1 in 1,000 people in the general population (prevalence = 0.1%).
- The test has 99% sensitivity (it catches 99% of true cases).
- The test has 99% specificity (it correctly clears 99% of healthy people).
Now imagine we test 100,000 people drawn from this population. Let’s count what happens.
How many people actually have the disease?
100,000 × 0.001 = 100 people
Of those 100 sick people, how many test positive?
100 × 0.99 = 99 true positives
How many people are healthy?
100,000 − 100 = 99,900 people
Of those 99,900 healthy people, how many test positive anyway?
99,900 × 0.01 = 999 false positives (because the test fails 1% of healthy people)
So out of all the positive results, we have:
- 99 true positives
- 999 false positives
- Total positives: 1,098
Now here’s the gut-punch question: if your test came back positive, what is the probability you actually have the disease?
P(disease mid positive test) = 99/99 + 999 = frac991,098 ≈ 9%
Nine percent. Despite a 99% accurate test, a positive result means you have roughly a 1-in-11 chance of actually being sick. The other 10 out of 11 people who test positive are perfectly healthy.
Why Does This Happen?
The culprit is the sheer weight of numbers. When a disease is rare, there are vastly more healthy people than sick ones. Even a tiny false-positive rate (1%) applied to a huge healthy population (99,900 people) produces a flood of false alarms — nearly 1,000 of them — that completely swamps the small number of genuine cases (99). The rare true positives drown in a sea of false ones.
This is sometimes called the base rate fallacy: our intuition ignores the base rate (prevalence) and fixates on the test’s accuracy alone. Bayes’ Theorem is the mathematical tool that forces us to account for the base rate properly.
Enter Bayes’ Theorem
The formula itself is elegant. For any hypothesis H (say, “I have the disease”) and any evidence E (say, “my test is positive”), Bayes’ Theorem states:
P(H mid E) = P(E mid H) · P(H)/P(E)
Let’s translate each piece into plain English:
- P(H | E) — the posterior probability: what we want to know. The probability our hypothesis is true given the evidence we’ve seen.
- P(E | H) — the likelihood: how probable is the evidence if the hypothesis is true? (This is sensitivity: 0.99.)
- P(H) — the prior probability: how probable was the hypothesis before we saw any evidence? (This is prevalence: 0.001.)
- P(E) — the total probability of the evidence: the overall chance of testing positive, regardless of whether you’re sick or healthy.
That last term, P(E), is the one that trips people up. We calculate it by considering both ways a positive result can happen:
P(E) = P(E mid H) · P(H) + P(E mid neg H) · P(neg H)
Which translates to:
P(E) = (0.99)(0.001) + (0.01)(0.999) = 0.00099 + 0.00999 = 0.01098
Plugging everything back in:
P(H mid E) = 0.99 × 0.001/0.01098 = 0.00099/0.01098 ≈ 0.090 = 9%
Same answer as before — and now you can see exactly where each number comes from.
The Insight That Changes Everything
Bayes’ Theorem is really telling us something profound: evidence updates beliefs, but the starting belief matters enormously.
Think of the prior probability as the anchor. If you’re being screened in a general, low-risk population, your anchor is very low (0.1%), so even a positive test can’t pull you all the way up to “probably sick.” But if you walked into the doctor’s office already showing symptoms, your prior might be 30% or 50% — and now a positive test does push you into “very likely sick” territory.
This is why doctors don’t (or shouldn’t) order tests indiscriminately. Screening a low-risk population for a rare disease generates a blizzard of false positives, causing anxiety, unnecessary follow-up procedures, and real harm. The math literally tells us when testing helps and when it misleads.
A More Encouraging Scenario: High-Prevalence Testing
Let’s see the flip side. Suppose you’re in a targeted clinic where 30% of patients have the disease (a high-risk group). Same test, same 99%/99% accuracy. Now what?
Out of 1,000 patients:
- 300 sick → 297 true positives, 3 missed
- 700 healthy → 7 false positives, 693 true negatives
P(disease mid positive) = 297/297 + 7 = 297/304 ≈ 97.7%
Now a positive result really does mean almost certainly sick. Identical test, wildly different meaning — because the prior changed.
Where Else Does Bayes Show Up?
Once you see this framework, you’ll spot it everywhere:
- Spam filters use Bayes’ Theorem to estimate the probability an email is spam given the words it contains, updating their beliefs with every new message.
- Court cases hinge on it. The “prosecutor’s fallacy” is essentially the base rate fallacy in a legal costume — confusing P(evidence | innocent) with P(innocent | evidence).
- Search and rescue teams use Bayesian search theory to update probability maps of where a missing person might be as each new area is searched.
- COVID-19 rapid tests sparked widespread public confusion precisely because people didn’t understand how prevalence affected the meaning of their results.
Your Mental Model to Take Away
Here’s the one-sentence version you can carry everywhere: a test result is only as meaningful as the prior probability it’s updating.
Whenever you encounter a statistic about test accuracy — whether it’s a medical screening, a lie-detector test, a breathalyzer, or a machine-learning classifier — ask yourself three questions:
- What is the base rate (how common is the thing being tested for)?
- What is the false positive rate (how often does the test fire when it shouldn’t)?
- How many false alarms does that rate produce across the full population of people being tested?
Run those numbers, and you’ll never be fooled by an impressive-sounding accuracy percentage again. The math doesn’t just protect you from unnecessary worry — it’s a compass for thinking clearly in an uncertain world.


Leave a Reply