


The sign says buses come every 20 minutes. You arrive without checking the schedule, so a reasonable guess is that you’ll wait 10 minutes: half the time between buses. But that answer quietly assumes the buses are evenly spaced. If some gaps are short and others are long, your average wait can be longer—even though the average time between buses is still 20 minutes.
The reason is a small trick of probability: you are more likely to arrive during a long gap than a short one. Once you see it, you’ll spot the same effect well beyond the bus stop.
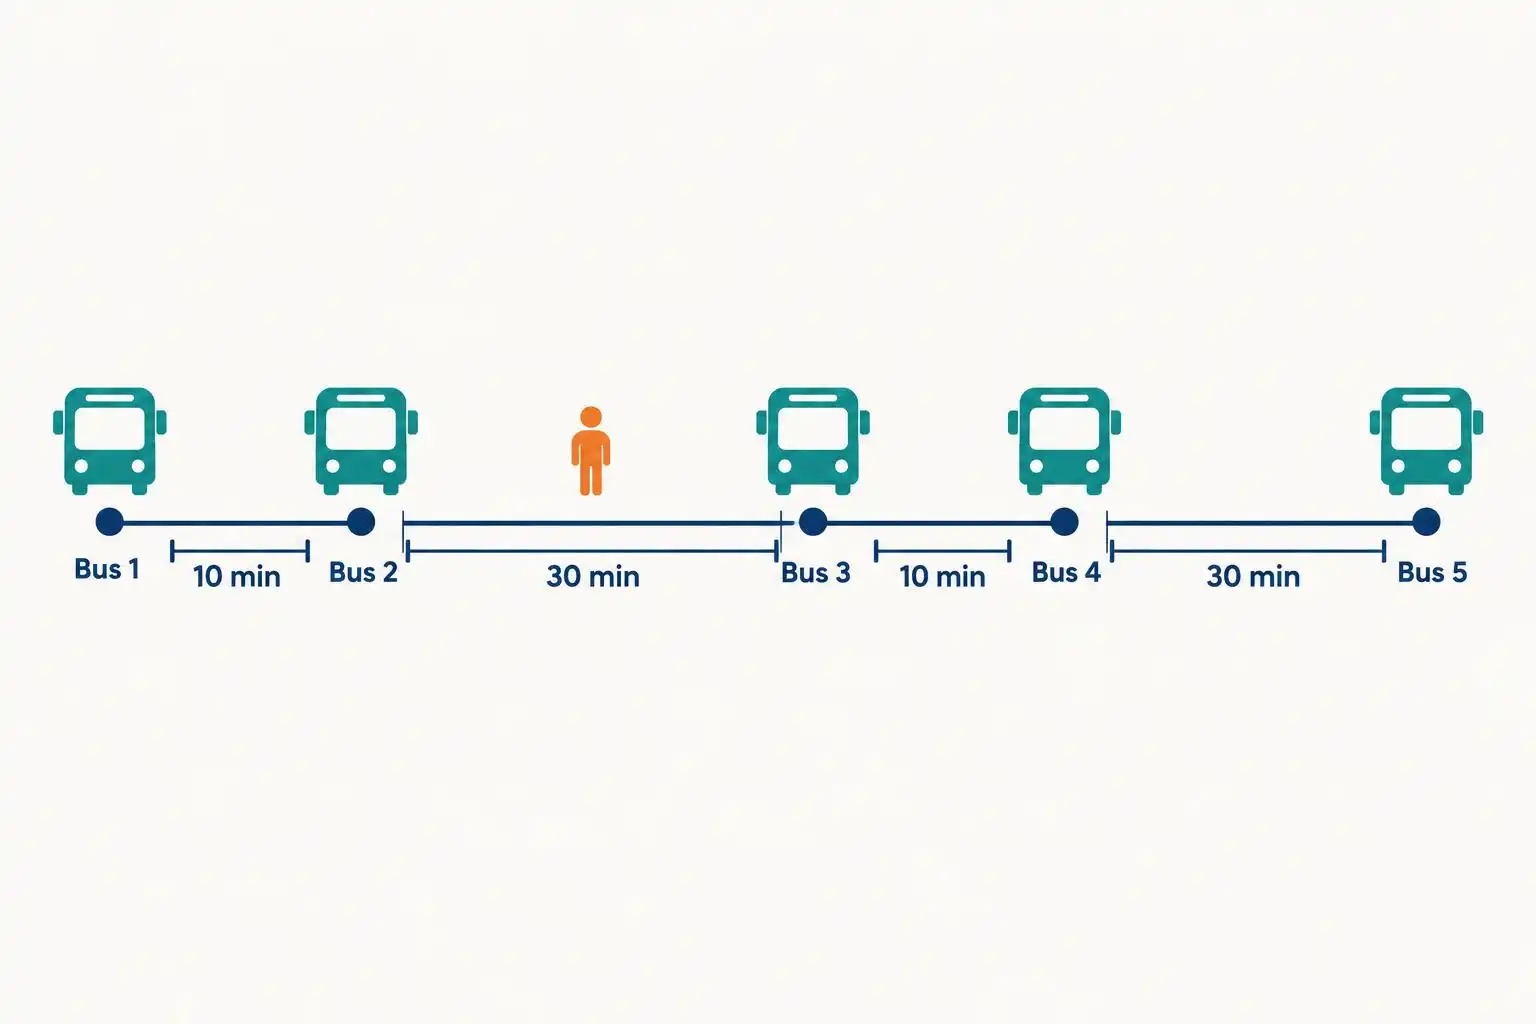
Two buses, two very different gaps
Imagine a route where buses alternate between arriving 10 minutes apart and 30 minutes apart. Over each 40-minute cycle, two buses arrive, so the average gap is indeed 20 minutes.
Now suppose you turn up at a random time, independently of the buses. A quarter of the cycle lies in a 10-minute gap; three-quarters lies in a 30-minute gap. That means you’re three times as likely to land in the long gap. The two gaps may occur equally often, but they do not occupy equal amounts of your day.
If you arrive somewhere within the 10-minute gap, your average wait is 5 minutes. Within the 30-minute gap, it’s 15 minutes. Weight those waits by how likely you are to experience each gap:
Average wait = (¼ × 5) + (¾ × 15) = 12.5 minutes.
That is 2.5 minutes longer than the 10-minute wait you’d expect if buses arrived exactly every 20 minutes. The number of buses has not changed. Only their spacing has.
Why a long gap gets more chances to catch you
Picture dropping a pin at random onto a timeline of bus arrivals. A 30-minute gap offers three times as much room for the pin as a 10-minute gap. When you sample by arriving at a random time, long gaps turn up more often than they do when you sample by counting gaps.
In fact, the average length of the gap you find yourself in is not 20 minutes. It is (¼ × 10) + (¾ × 30) = 25 minutes. Arrive at a random point within that gap, and your average remaining wait is half its length: 12.5 minutes.
This is called length-biased sampling. The thing you are measuring affects how likely you are to encounter it. It isn’t that the timetable’s 20-minute average is wrong; it answers a different question from “How long will someone who arrives at random wait?”
The calculation for any pattern of gaps
There’s a compact way to see what happens when bus gaps have many different lengths. Call a gap’s length T. For a particular gap of length T, someone arriving uniformly within it waits T/2 minutes on average. But the chance of landing in that gap is proportional to T. Put those together, and long gaps contribute in proportion to T², not just T.
If E[T] means the average gap and E[T²] means the average of the squared gaps, the expected wait for an independent, random arrival is:
Average wait = E[T²] / (2E[T]).
For our alternating route, E[T] = (10 + 30)/2 = 20. Meanwhile, E[T²] = (10² + 30²)/2 = 500. So the formula gives 500 / (2 × 20) = 12.5 minutes, just as our timeline did.
Squaring makes the penalty for uneven spacing visible. With perfectly even 20-minute gaps, E[T²] is 400 and the wait is 10 minutes. Mixing 10- and 30-minute gaps raises E[T²] to 500, even though E[T] stays at 20. More variation means more time spent at the mercy of unusually long gaps.
When the paradox applies—and when it doesn’t
This calculation assumes you arrive at a time unrelated to the bus arrivals and that the pattern continues long enough for the short and long gaps to balance out. If you check a reliable live arrival board and time your walk to the stop, you are no longer arriving at random. Your wait may be much shorter.
It also helps explain why a service can feel worse after buses start bunching together. A short gap lets a second bus follow close behind the first, while the resulting long gap leaves more people waiting. A simple average of the gaps can miss what those people experience.
The usable rule is this: when you encounter something by showing up at a random time, ask how long each possible interval lasts—not just how often it occurs. Your clock is more likely to catch a long gap. And that can make a perfectly accurate average a poor prediction of your next wait.


Leave a Reply
You must be logged in to post a comment.