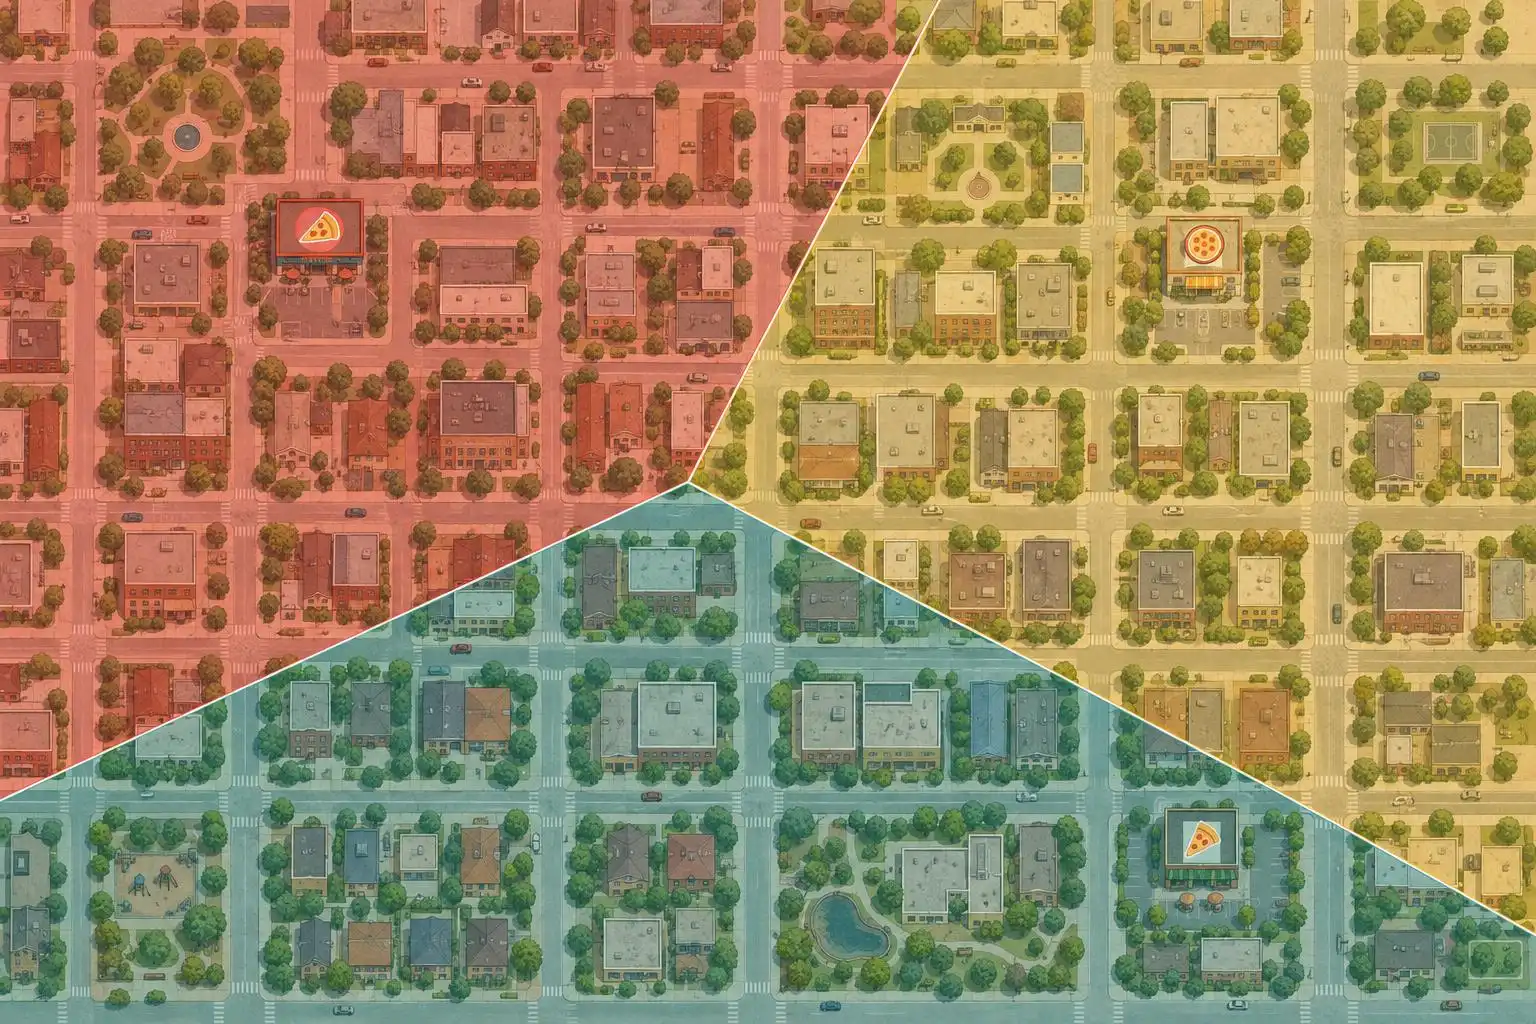

Imagine opening a map to order a pizza. Three stores serve your neighborhood, and the ordering system needs to decide which one is closest. It could measure the distance from your address to every store. But if it has thousands of addresses to handle, there’s another way to think about the job: draw a map showing which store wins at every possible location.
That map is called a Voronoi diagram. Its lines mark the places where two stores are equally far away. Step across a line, and a different store becomes your nearest one. The idea is simple enough to draw with a ruler, yet useful for thinking about everything from delivery areas to the placement of public facilities.
Start With Two Stores
Put one pizza store at point A and another at point B on a map. At any location closer to A, an order would go to A; at any location closer to B, it would go to B. What separates the two areas?
Find the midpoint of the line joining the stores, then draw a line through that midpoint at a right angle. This is the perpendicular bisector. Every point on it is equally far from A and B. Moving to one side takes you closer to A; moving to the other takes you closer to B. So one straight line divides the whole map into two nearest-store neighborhoods.
With three stores, each pair has a potential dividing line. Keep only the parts where those two stores really are the closest choices. The resulting regions fit together like tiles, with one tile for each store. Those tiles are the Voronoi diagram.
Work Out a Delivery Address
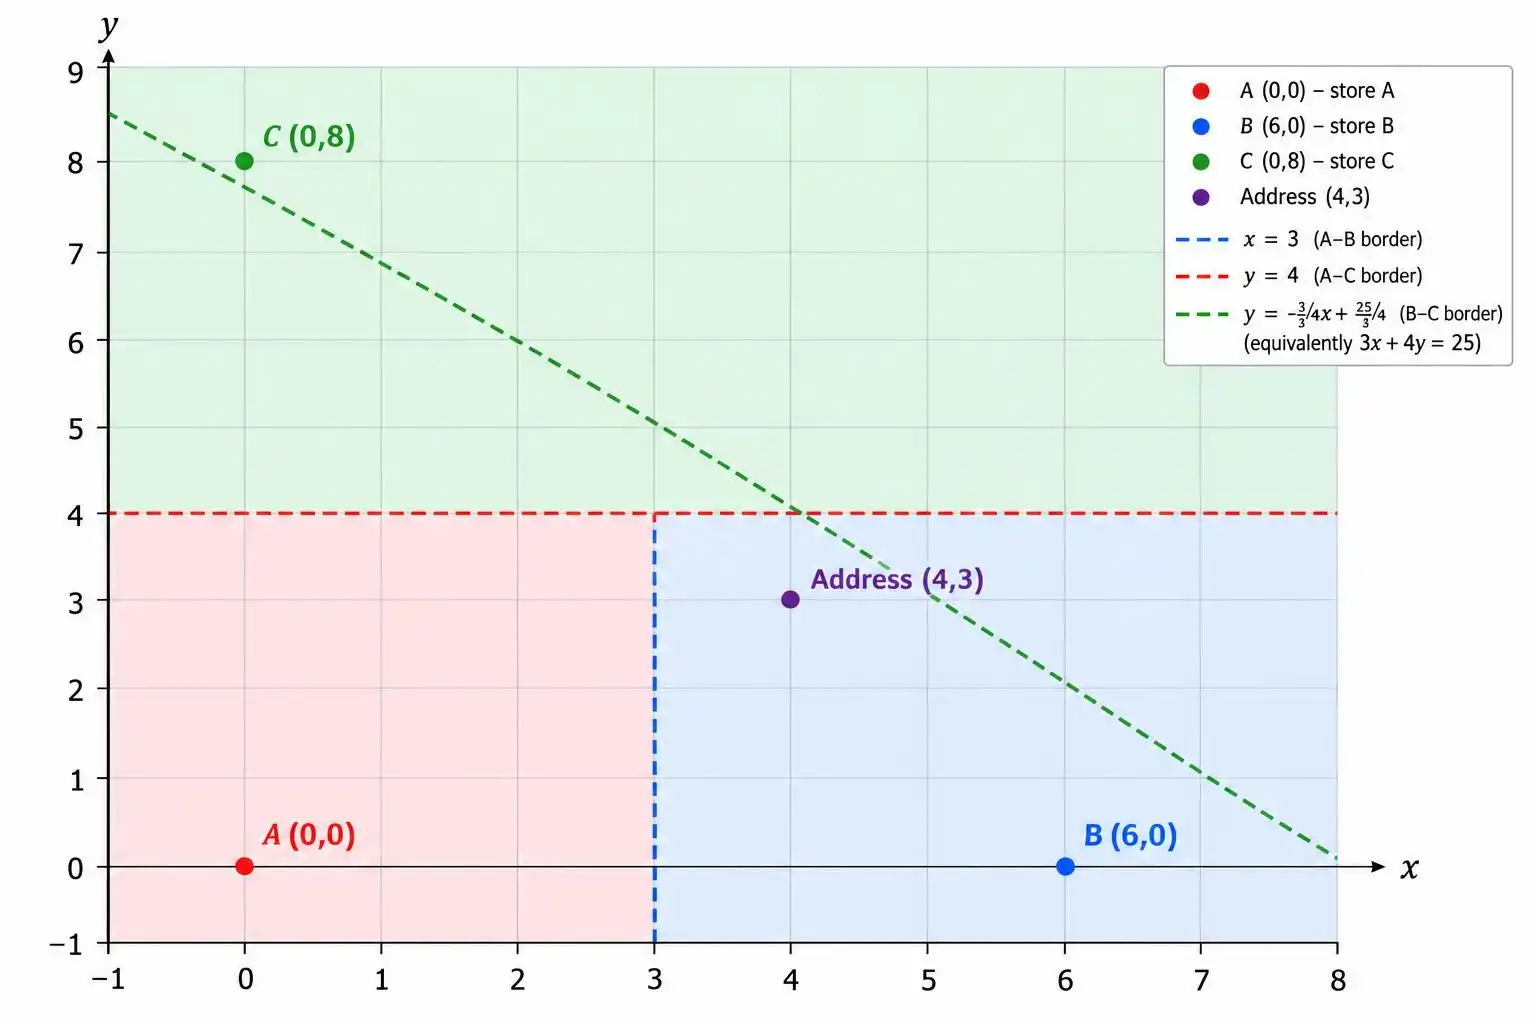
Suppose distances on a simplified city map are measured in kilometers. Store A is at (0, 0), store B at (6, 0), and store C at (0, 8). An address at (4, 3) is four kilometers east and three kilometers north of A.
To find a straight-line distance between two points, treat their east–west and north–south separations as the sides of a right triangle. Square those separations, add them, and take the square root. For our address, that gives:
- To A: √(4² + 3²) = 5 km.
- To B: √((4 − 6)² + 3²) = √13 ≈ 3.6 km.
- To C: √(4² + (3 − 8)²) = √41 ≈ 6.4 km.
B wins. But the diagram tells us more than the answer for one address: it tells us where B will win for any address in its region.
Find the Borders Without Measuring Every Address
A and B lie on the same horizontal line, six kilometers apart. Their midpoint is (3, 0), so their equal-distance border is the vertical line x = 3. An address to its right, including (4, 3), is closer to B than to A.
A and C are eight kilometers apart vertically. Their border is the horizontal line y = 4. Above it, C is closer than A; below it, A is closer than C. At our address, y is 3, so A beats C—but B beats them both.
The B–C border is slanted. If an address has coordinates (x, y), its squared distances to B and C are (x − 6)² + y² and x² + (y − 8)². Set them equal, expand the squares, and the x² and y² terms cancel. What remains simplifies to 4y − 3x = 7: another straight line.
At (3, 4), all three borders meet. That point is five kilometers from each store: √(3² + 4²) from A, and the same distance from B and C. It’s the one place on this map where the customer could choose any store without changing the straight-line distance.
What the Diagram Does—and Doesn’t—Tell You
A Voronoi diagram turns many repeated distance comparisons into a picture. Once the store locations are fixed, you can locate an address inside a region and identify its nearest store. You can also see where the decision is fragile: an address near a border might switch stores after even a small change in location.
The catch is that our diagram measures distance as the crow flies. A delivery driver follows streets. A river with only one bridge, a one-way road, or a traffic jam might make the geometrically nearest store slower to reach. You can build a different nearest-store map using travel times instead, but its borders may bend into complicated shapes.
Nor is the closest store automatically the best one. If B has a long order queue while A has a free driver, A might deliver sooner. Geometry answers a precise question—which location is nearest under the distance rule we chose?—not every question about service.
A Map-Making Mental Shortcut
Whenever several places compete to be “nearest,” picture the borders first. Between two locations, the straight-line-distance border sits halfway between them and crosses their connecting line at a right angle. Add more locations, and those borders carve the map into regions.
That is the usable insight behind a Voronoi diagram: a question about countless individual addresses can become a question about a few boundaries. Just check what “distance” means before trusting the answer.


Leave a Reply