

A cashier can serve twelve shoppers an hour. Nine shoppers arrive each hour. That sounds comfortable: the cashier is busy only 75% of the time. Yet in a simple mathematical model of this checkout, the average shopper spends twenty minutes there, including time in line. How can a five-minute transaction turn into a twenty-minute visit?
The culprit is not unusually slow service. It is the way unpredictable arrivals create a backlog—and the shrinking amount of spare capacity available to clear it.
Averages Hide the Rushes
Suppose shoppers arrive independently at an average rate of nine per hour, while one cashier takes an average of five minutes per shopper. Five minutes per transaction means a service rate of twelve shoppers per hour. The arrival rate is nine per hour.
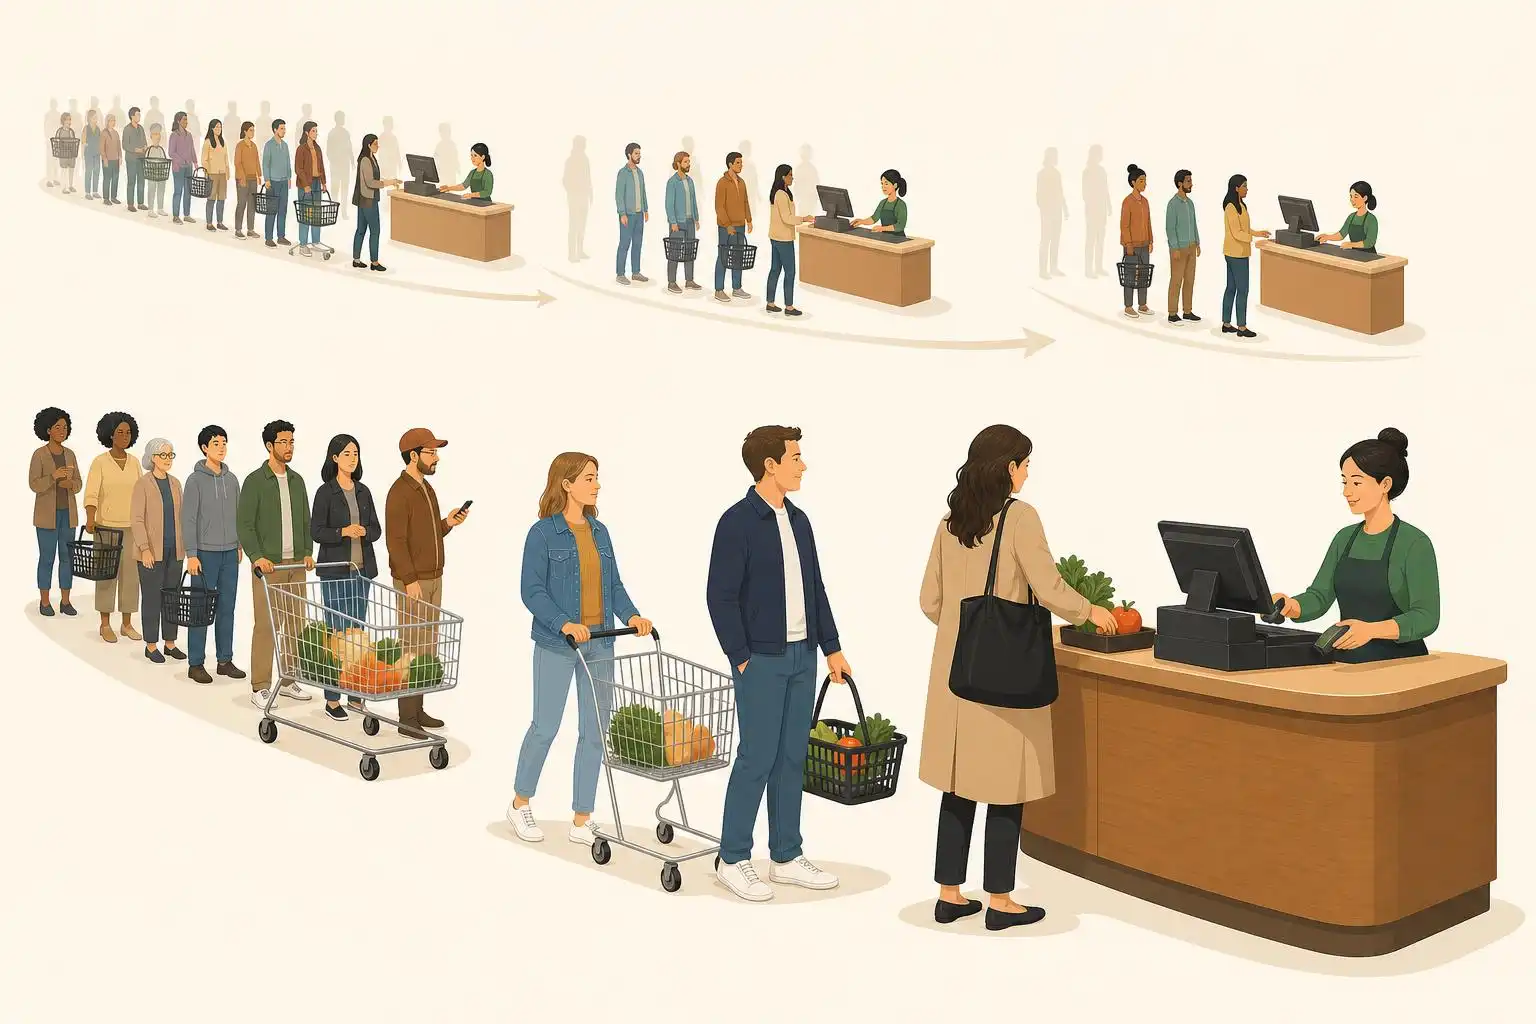
These are averages, not a timetable. Three shoppers might appear almost together, followed by a quiet stretch. The cashier cannot serve all three at once, so a line forms. During the quiet stretch, the cashier can work through it—but only if the quiet stretch lasts long enough.
The fraction of time the cashier is busy is the arrival rate divided by the service rate: 9 ÷ 12 = 0.75, or 75%. That leaves a quarter of the time idle. Crucially, idle time is not wasted capacity in this story. It is the breathing room that lets the checkout recover after a rush.
Why a Line Keeps Growing After the Rush
Imagine six shoppers arrive close together. Serving them takes about thirty minutes on average. Meanwhile, at nine arrivals per hour, roughly 4.5 more shoppers will arrive during those thirty minutes. Clearing the original six does not mean the line has vanished.
This is why spare capacity matters more than the cashier’s speed alone. On average, the cashier can finish twelve transactions each hour while nine new shoppers join. When there is a backlog, the line shrinks at a net rate of just three shoppers per hour: twelve served minus nine arriving.
That does not mean every group of three takes exactly an hour to clear. Arrivals and service times fluctuate. It does show why recovery feels sluggish even when each individual transaction is fairly quick.
Putting a Number on the Wait
For a precise estimate, consider an idealized queue: arrivals happen independently at a steady average rate, service times follow an exponential distribution with a five-minute average, and shoppers are served one at a time in arrival order. Mathematicians call this an M/M/1 queue. The label matters less than its assumptions; a checkout with scheduled appointments or nearly identical transaction times will behave differently.
Let ρ (the Greek letter rho) be the busy fraction. Here, ρ = 9/12 = 0.75. In this model, the chance of finding nobody at the checkout is 1 − ρ = 0.25. The chance of finding exactly one shopper is 0.25 × 0.75 = 0.1875. Each additional shopper multiplies the probability by another 0.75.
That pattern gives an average of ρ/(1 − ρ) shoppers at the checkout, counting anyone being served. At ρ = 0.75, the average is 0.75/0.25 = three shoppers. One useful rule, called Little’s law, connects this average to time: average shoppers present = arrivals per hour × average hours spent there. So the average visit lasts 3 ÷ 9 hour, or twenty minutes.
Only five of those twenty minutes are spent being served, on average. The other fifteen are spent waiting. The calculation does not predict any particular shopper’s visit; some will find an empty checkout, while others will arrive behind a rush.
The Last Bit of Capacity Is the Most Valuable
The same calculation simplifies to a handy formula: average time at the checkout, in hours, is 1 ÷ (service rate − arrival rate). With service at twelve shoppers per hour, watch what happens as arrivals increase:
- Six arrivals per hour: 1 ÷ (12 − 6) hour = 10 minutes total, including five minutes of service.
- Nine arrivals per hour: 1 ÷ (12 − 9) hour = 20 minutes total.
- Eleven arrivals per hour: 1 ÷ (12 − 11) hour = 60 minutes total.
Going from nine to eleven arrivals per hour adds only two shoppers an hour, but it triples the average time. At twelve arrivals per hour, the model has no finite long-run average wait: random rushes build lines that the cashier has no spare capacity to reliably clear. Above twelve, the backlog grows on average.
A Useful Way to Think About Busy Systems
This mathematics applies well beyond grocery stores. A help desk, a delivery dock, or a computer server can look adequately staffed when its average demand is below its average capacity. If the gap is small, though, ordinary variation can produce long delays.
The model is a starting point, not a universal forecast. Real arrivals may cluster, some jobs take longer than others, and people may leave a line when it gets too long. Those details can change the numbers. The usable insight remains: when demand is unpredictable, capacity left unused between rushes is what makes short waits possible.


Leave a Reply