

LeBron James hits seven three-pointers in a row. A roulette wheel lands on red six times straight. Your colleague has correctly predicted the last five Monday morning meetings would run over time. In every case, a powerful voice in your head whispers the same thing: this is not a coincidence. Something real is happening here. There’s a pattern. There’s momentum. There’s a streak.
That voice is almost always wrong — and the mathematics of probability can tell us exactly why, how often streaks should appear by pure chance, and when (rarely, fascinatingly) they actually do signal something real.
Why Our Brains Are Streak-Seeking Missiles
Human beings are pattern-recognition machines. This was a survival advantage for most of our evolutionary history. If the rustling in the grass preceded a predator three times in a row, the ancestor who noticed that pattern and ran lived longer than the one who shrugged. We are, quite literally, built to find signal in noise.
The trouble is that in a probabilistic world — one full of coin flips, stock prices, basketball shots, and weather — our pattern-detectors fire constantly and indiscriminately. We see streaks as meaningful when they are, statistically speaking, exactly what we should expect from randomness.
This isn’t a character flaw. It’s a calibration problem. And math is the recalibration tool.
The Coin-Flip Baseline
Let’s start with the simplest possible random process: flipping a fair coin. Each flip is independent — meaning the coin has no memory, and the result of any one flip doesn’t affect the next. Heads is always 50%, tails is always 50%, no matter what just happened.
Now here’s the question that surprises almost everyone:
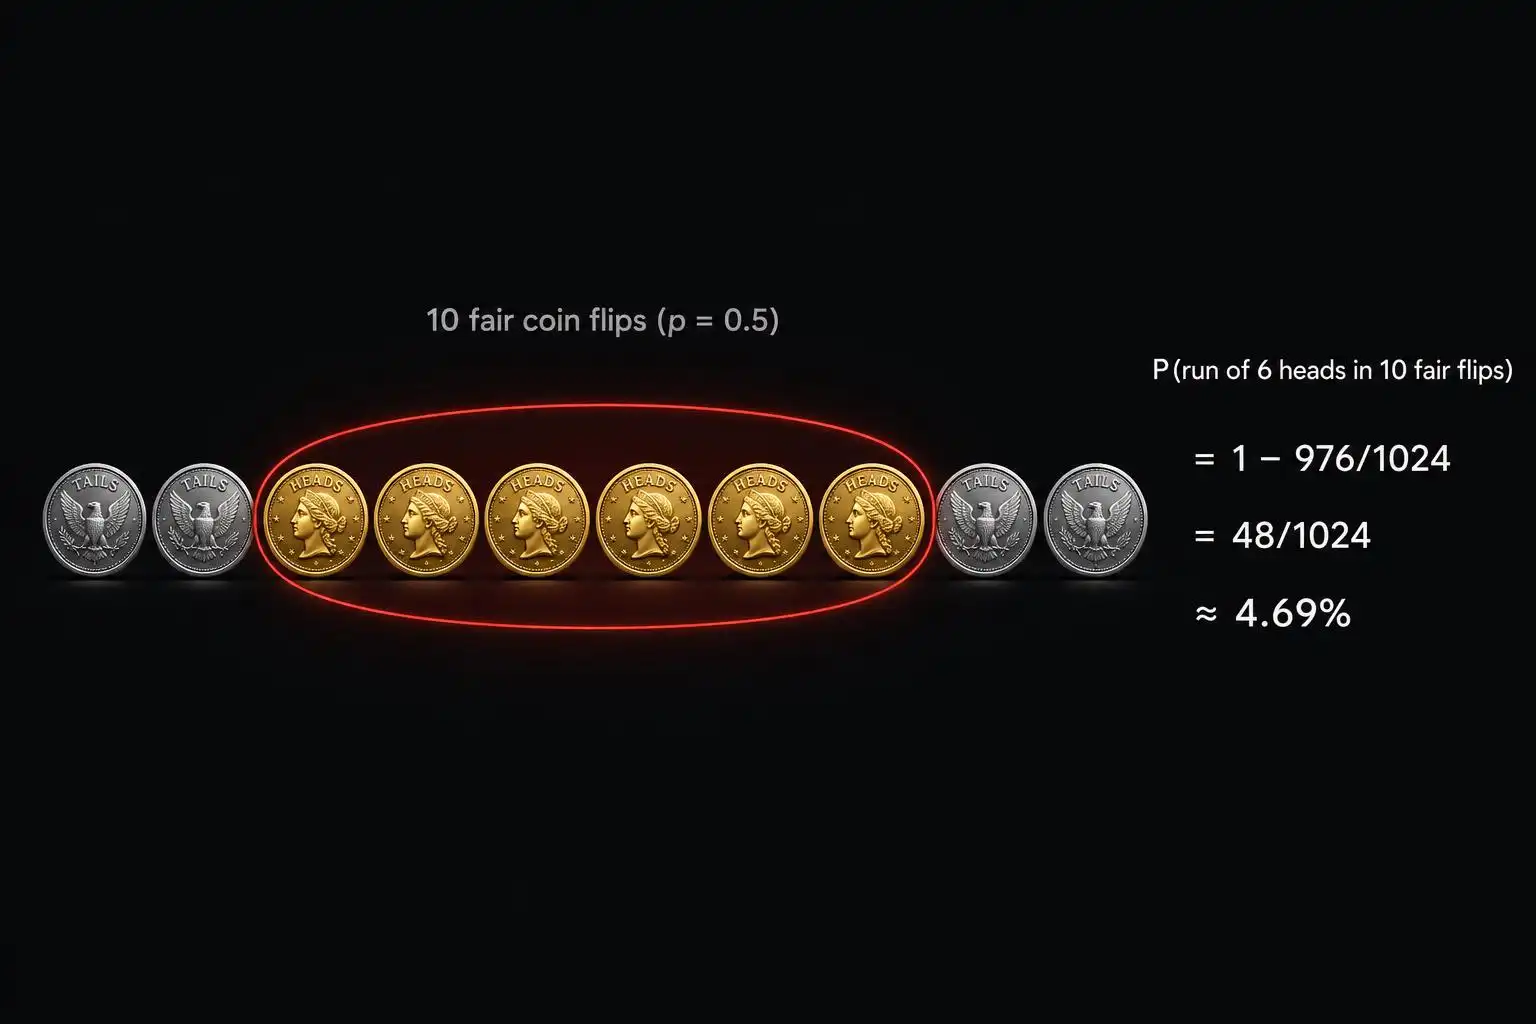
If you flip a fair coin 100 times, what is the probability that you’ll see at least one run of six heads in a row?
Most people guess something small — maybe 10%, maybe 20%. The actual answer is approximately 55%.
Let’s build up to that. First, the probability of getting exactly six heads in a specific set of six flips is:
left(1/2right)6 = 1/64 ≈ 1.6%
That seems rare. But in 100 flips, there are roughly 95 different “windows” of six consecutive flips (starting at flip 1, flip 2, … flip 95). Each window has a ~1.6% chance of being all heads. These windows overlap, so they’re not independent, and the exact calculation requires some careful inclusion-exclusion combinatorics — but the intuition is clear: many opportunities for a rare event add up to a near-certainty.
The formal way to estimate the probability of no run of six heads uses a recurrence relation. Define P(n) as the probability that a sequence of n flips contains no run of six consecutive heads. It satisfies:
P(n) = 1/2P(n-1) + 1/4P(n-2) + 1/8P(n-3) + 1/16P(n-4) + 1/32P(n-5) + 1/64P(n-6)
Working through this recurrence (with initial conditions P(0) through P(5) all equal to 1), by the time n = 100 the probability of no run of six heads drops to roughly 45%. So the probability of at least one such run is about 55%.
The lesson: in any sufficiently long sequence of random events, long streaks are not anomalies. They are the expected furniture of randomness.
The Hot Hand: A Famous Debate
In 1985, psychologists Thomas Gilovich, Robert Vallone, and Amos Tversky published one of the most provocative papers in sports science. They analyzed shooting data from the Philadelphia 76ers and found something stunning: the “hot hand” in basketball didn’t exist.
Players who had just made three or four shots in a row were no more likely to make the next shot than players who had just missed. The streaks fans and players swore by were, statistically, indistinguishable from what you’d expect from a random sequence of makes and misses.
The sports world was outraged. Coaches, players, and commentators insisted the data was wrong. Of course momentum is real. Of course a shooter “gets in a zone.”
Then, in 2016, economists Joshua Miller and Adam Sanjurjo discovered something remarkable: the original study had a subtle but significant statistical bias. When you look at a finite sequence and ask “after a hit, what’s the probability of the next shot being a hit?”, you are sampling from a biased subset of the sequence — and this systematically underestimates the hot-hand effect.
After correcting for this bias, reanalyzing the original data and new datasets, Miller and Sanjurjo found evidence that the hot hand is real, at least in some contexts. A shooter who has just made three shots really does seem to have a slightly elevated probability on the next attempt.
The debate isn’t fully settled, but the story is a perfect illustration of how hard it is to separate genuine streaks from random noise — and how even professional statisticians can get it wrong.
The Gambler’s Fallacy: Streaks’ Evil Twin
If one cognitive trap is overbelieving in streaks (the hot hand fallacy), the equal and opposite trap is expecting streaks to self-correct — the Gambler’s Fallacy.
Here’s the scenario: a roulette wheel has landed on red eight times in a row. Most people feel a powerful pull toward betting on black, reasoning that “it’s due.” But a fair roulette wheel has no memory. The probability of red on the next spin is exactly the same as it was before the streak began: roughly 48.6% (accounting for the single green zero slot in European roulette).
The eight previous reds have zero causal influence on the ninth spin. The wheel doesn’t know it’s been on a streak. The universe is not keeping score.
The Gambler’s Fallacy and the Hot Hand Fallacy are, in a deep sense, the same mistake applied in opposite directions. Both assume that recent history contains information about the next outcome when, for a truly independent process, it contains none.
The key question — the one that separates good statistical thinking from bad — is always: Is this process independent, or does past performance genuinely affect future probability?
For a fair coin or a roulette wheel: independent. Past streaks tell you nothing.
For a basketball shooter, a pitcher’s arm, or a company’s quarterly earnings: possibly not independent. There may be real underlying states (fatigue, confidence, market conditions) that persist across observations and create genuine autocorrelation.
Worked Example: The Birthday Problem’s Cousin
Here’s a related puzzle that makes the streak math concrete in a different way.
Imagine a call center where each agent independently closes a sale with probability p = 0.3 on any given call. The manager notices that one agent closed five sales in a row and concludes she must be exceptional. Should he be impressed?
Let’s calculate. The probability of five consecutive sales for a 30%-success-rate agent is:
0.35 = 0.00243
About 0.24% — less than 1 in 400. Rare! But here’s the context: the call center has 50 agents, each making 200 calls per day. That’s 10,000 calls per day, with roughly 10,000 − 4 = 9,997 possible starting positions for a five-call window.
The expected number of five-in-a-row streaks across the entire call center in a single day is approximately:
9,997 × 0.00243 ≈ 24
Twenty-four such streaks are expected to appear every single day just by chance. The manager who singles out one agent for a streak that appears 24 times daily across the floor is almost certainly seeing noise, not signal.
This is the multiple comparisons problem in disguise: when you look at many people, many stocks, many players, or many anything, extreme-looking events become routine. The rarest-seeming outcome in a large group is almost always less remarkable than it appears.
When Streaks Are Real: The Autocorrelation Test
So how do you tell the difference between a meaningful streak and random noise? Statisticians use a tool called autocorrelation — measuring whether an outcome at time t is correlated with the outcome at time t−1, t−2, and so on.
Here’s the intuition. Take a sequence of results and ask: if the last outcome was a success, is the next outcome more likely to also be a success than the base rate would predict?
You measure this by computing the lag-1 autocorrelation coefficient, which runs from −1 to +1:
- Near 0: the process is essentially independent. Past results don’t predict future results. Streaks are just noise.
- Positive: past successes predict future successes. There’s genuine momentum or persistence. Streaks are (partially) real.
- Negative: past successes predict future failures — mean reversion. The process is “self-correcting.”
For truly independent coin flips, the autocorrelation is 0. For a basketball player whose confidence genuinely builds during a hot streak, we’d expect a small positive autocorrelation. For a stock market that mean-reverts (as short-term equity returns sometimes do), we’d expect a small negative autocorrelation.
The test doesn’t tell you why there’s autocorrelation — that requires domain knowledge. But it tells you whether streaks in your data are consistent with pure randomness, and that’s the crucial first question.
The Practical Takeaway: A Streak Checklist
The next time you encounter a streak — in sports, investing, hiring, medicine, or your own life — run through these three questions before deciding it means something:
1. How many opportunities were there?
A streak that looks rare in isolation may be nearly inevitable given the number of trials. Calculate the expected number of such streaks under pure randomness. If it’s greater than 1, be skeptical.
2. Is the underlying process independent?
If there’s a plausible mechanism by which past outcomes genuinely influence future ones — fatigue, skill development, market sentiment, disease transmission — the streak may be real. If there’s no such mechanism, default to the null hypothesis of randomness.
3. Is the sample size large enough to detect autocorrelation?
Even if autocorrelation exists, you need a lot of data to distinguish a small real effect from noise. A five-game winning streak in a 16-game season is almost never statistically significant evidence of anything. A five-year earnings growth record in a company with stable management might be.
The Deeper Lesson
There’s something almost philosophical about the mathematics of streaks. Randomness — pure, memoryless, indifferent randomness — is lumpy. It clumps. It runs. It produces sequences that look, to our pattern-hungry brains, like they must have a cause.
The universe doesn’t distribute its coin flips evenly. If it did — HTHTHTHTHT forever — that would actually be the suspicious pattern, the one that signals something non-random is happening.
Real randomness looks messy and streaky and meaningful. Learning to sit with that, to resist the narrative that every run of good or bad luck is a signal about the future, is one of the most practically useful things probability theory can teach you.
And the next time someone tells you a trader is “on a roll” or a team has “all the momentum,” you’ll know exactly what question to ask first: How many traders and teams were we watching, and how many streaks did we expect to see?
The answer, almost always, is more than you’d think.


Leave a Reply